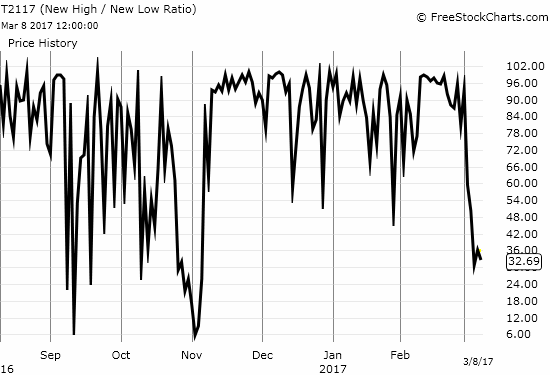
(T2108 measures the percentage of stocks trading above their respective 40-day moving averages [DMAs]. It helps to identify extremes in market sentiment that are likely to reverse. To learn more about it, see my T2108 Resource Page. You can follow real-time T2108 commentary on twitter using the #T2108 hashtag. T2108-related trades and other trades are occasionally posted on twitter using the #120trade hashtag. T2107 measures the percentage of stocks trading above their respective 200DMAs)
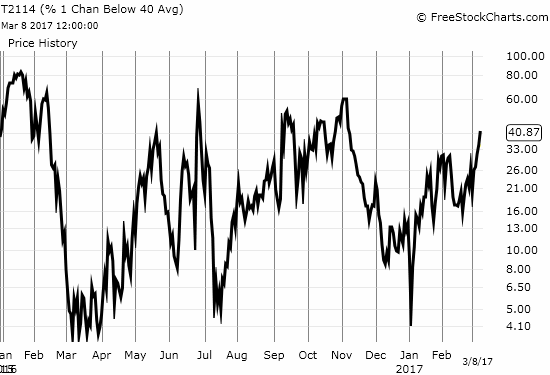
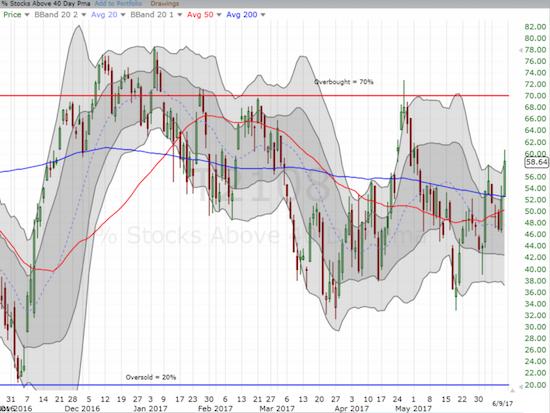
T2108 Status: 57.9%
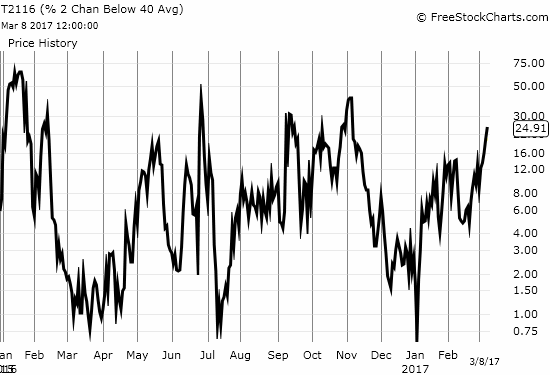
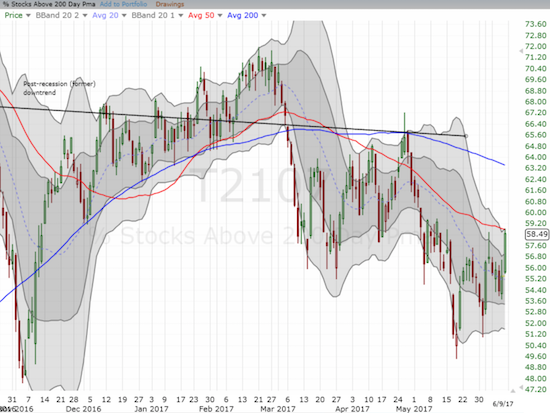
T2107 Status: 74.2%
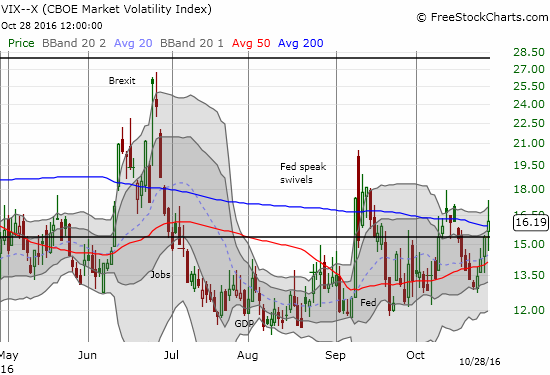
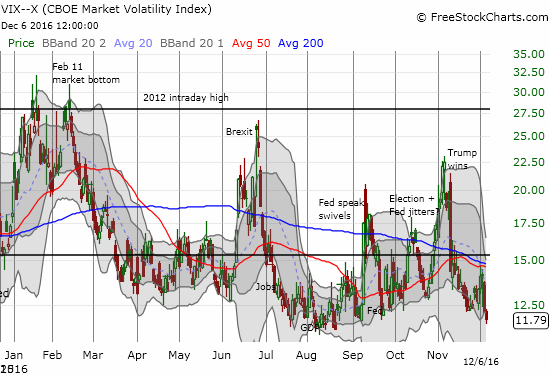
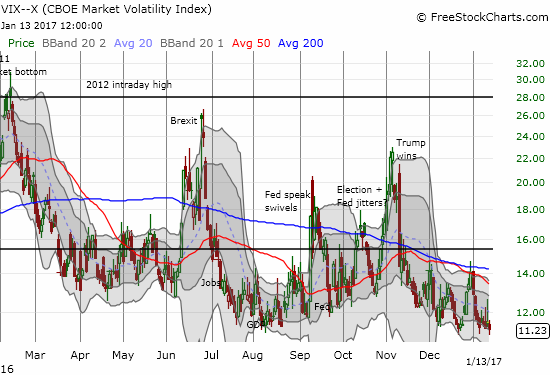
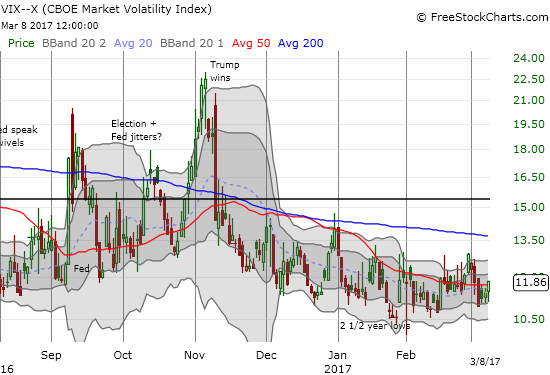
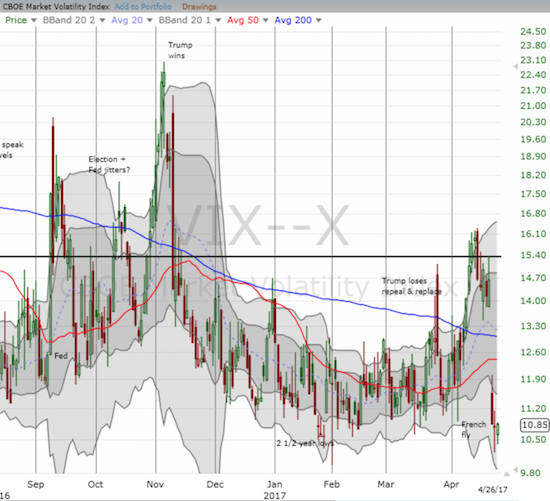
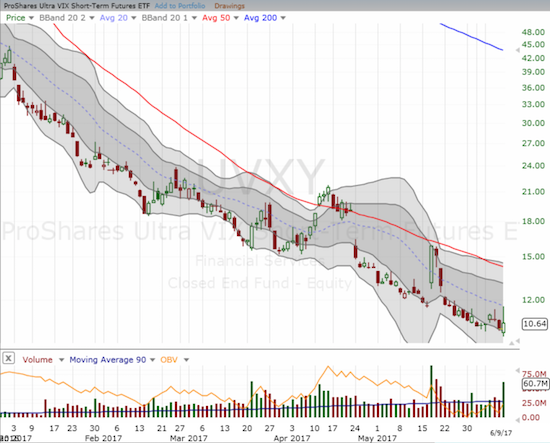
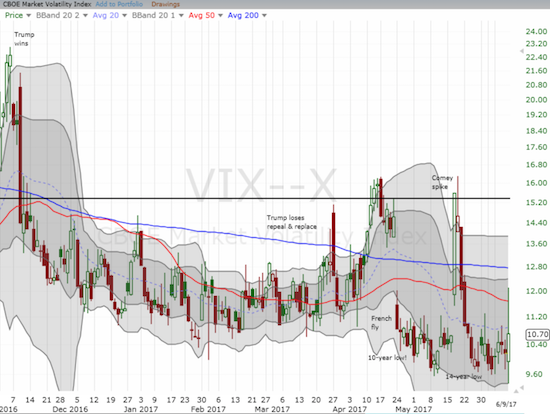
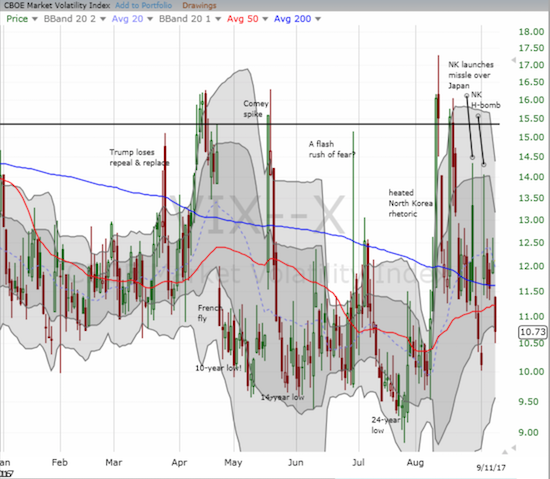
VIX Status: 12.0 (fell 11.1%)
General (Short-term) Trading Call: cautiously bearish
Active T2108 periods: Day #139 over 20%, Day #45 over 30%, Day #44 over 40%, Day #43 over 50% (overperiod), Day #6 under 60% (underperiod), Day #21 under 70%
Commentary
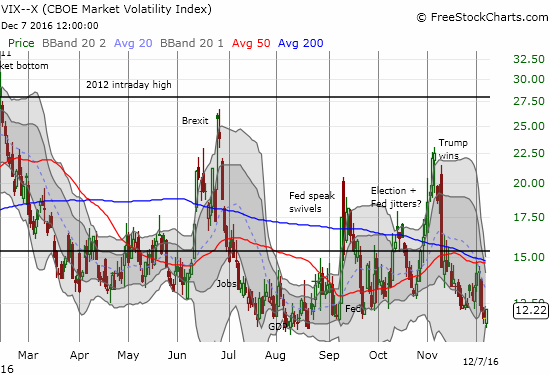
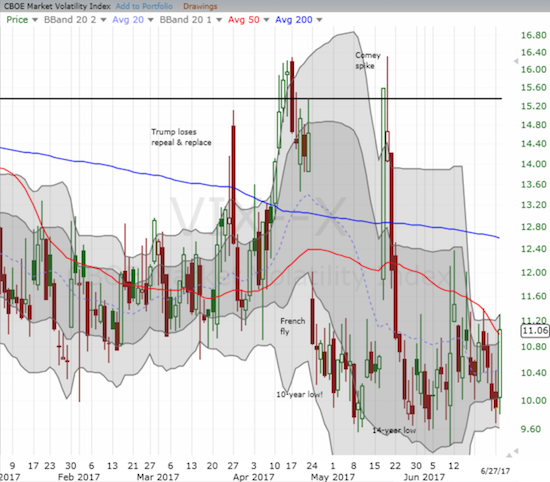
After my last T2108 Update, I eagerly awaited a long overdue eruption of volatility. I am still waiting. After Friday’s jobs report missed “expectations,” volatility took a dive off the deep end and left intact the ceiling at the critical 15.35 pivot.
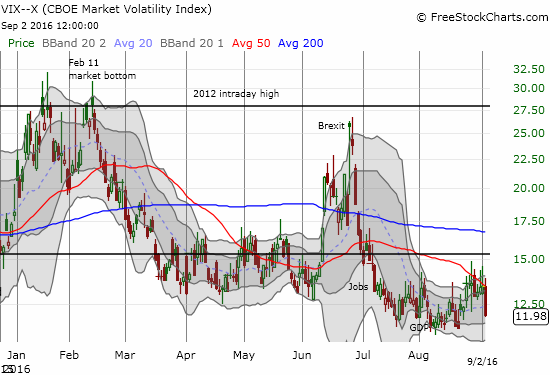
Back to the drawing board for the volatility index, the VIX.
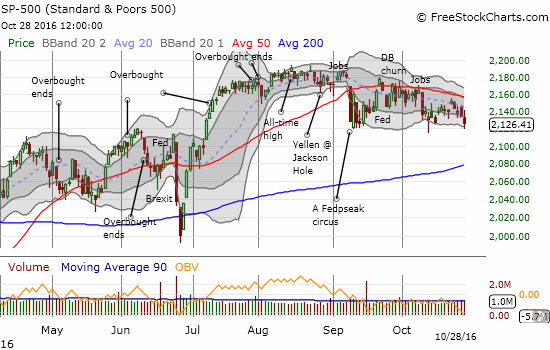
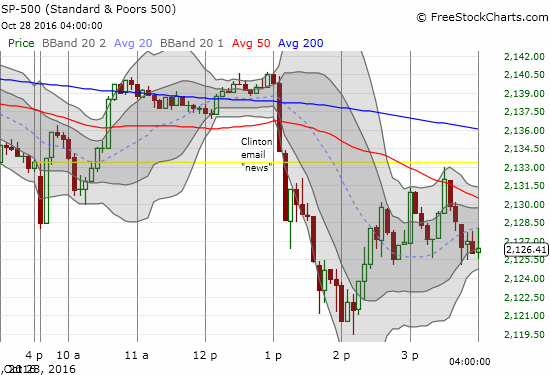
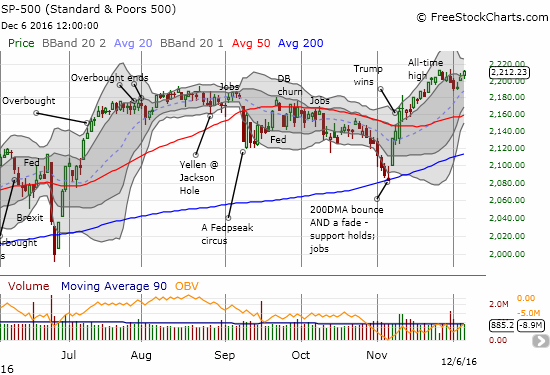
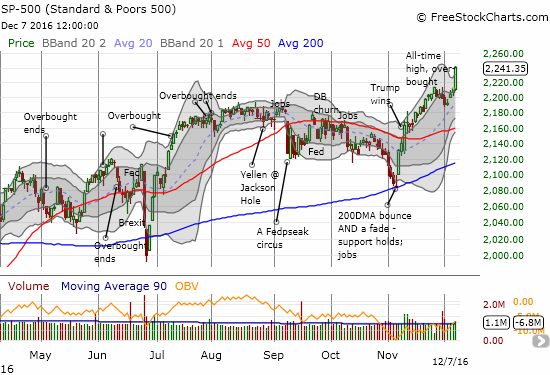
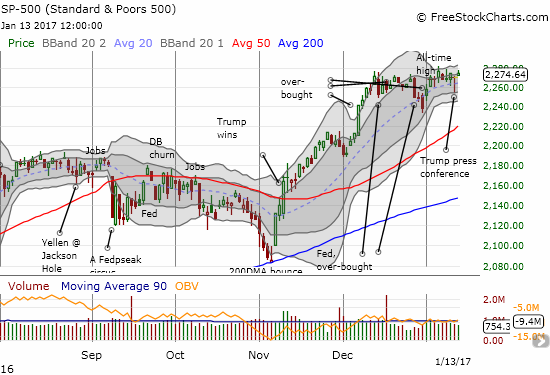
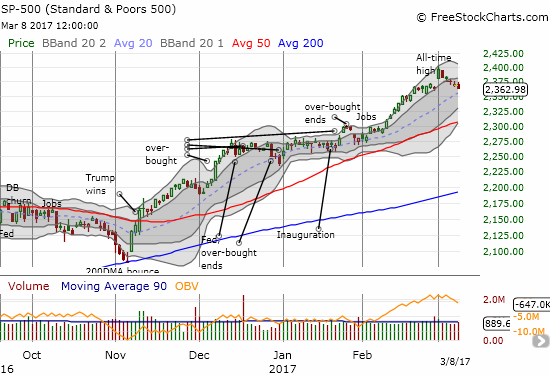
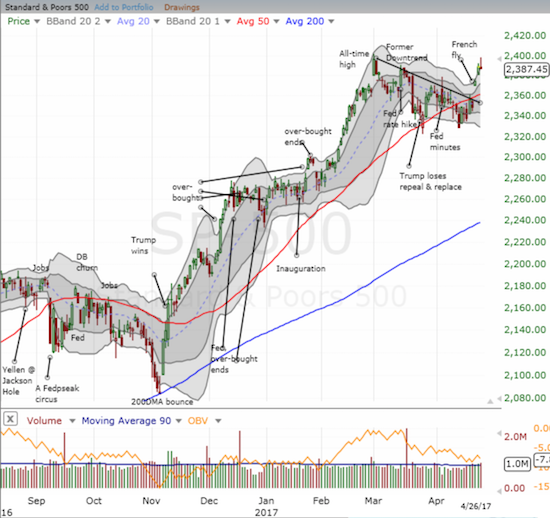
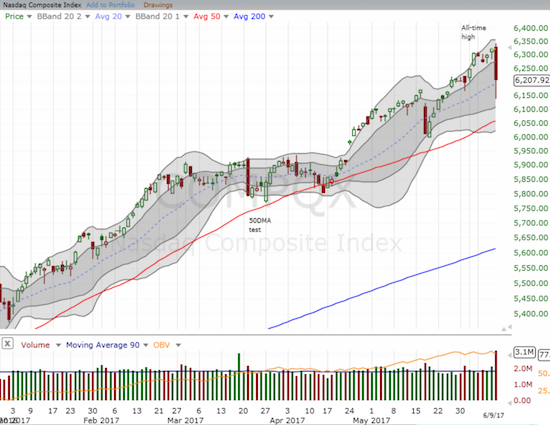
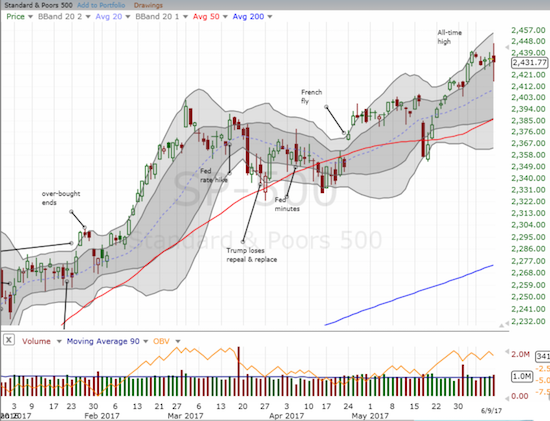
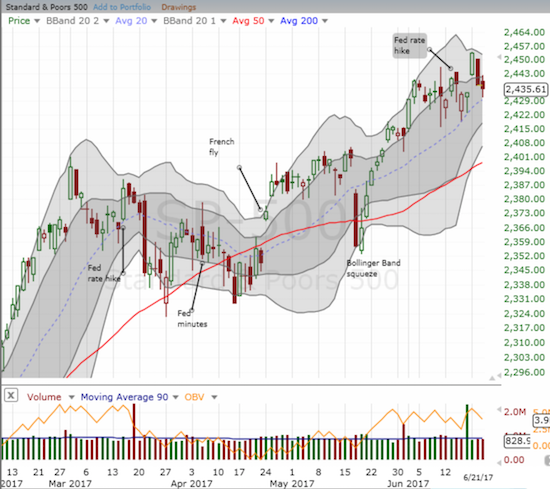
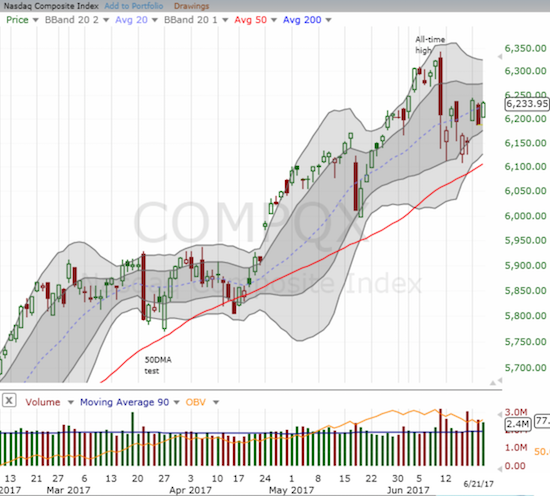
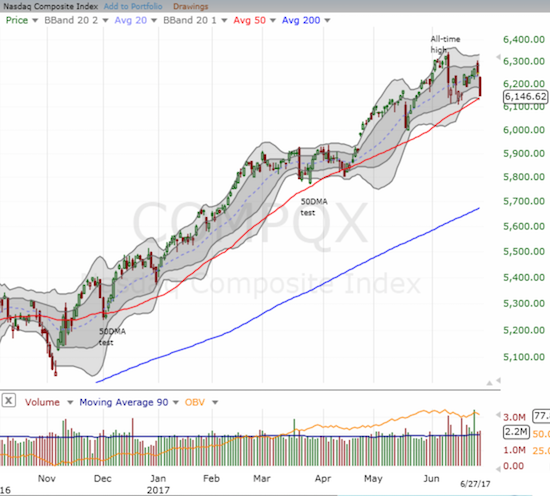
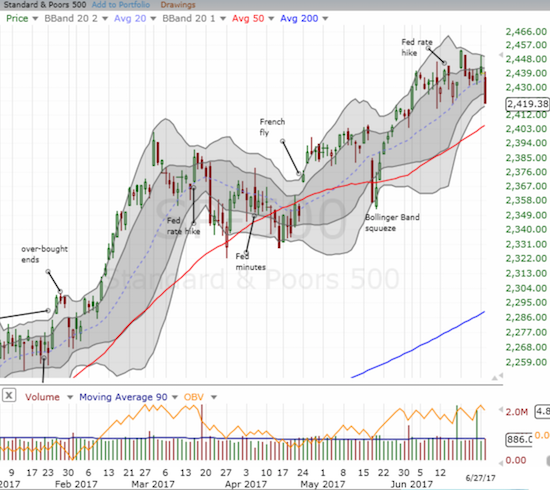
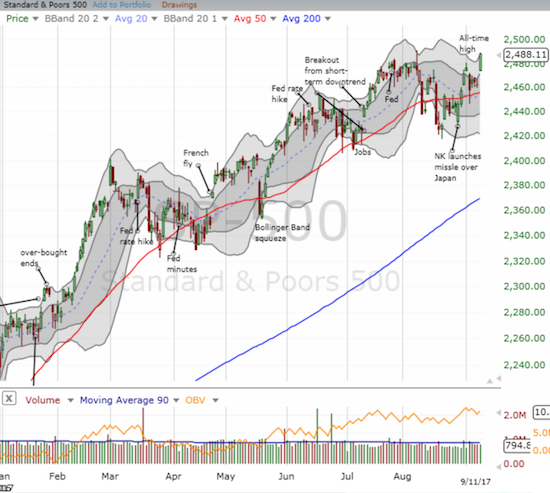
Along with the plunge in volatility, the S&P 500 (SPY) gapped back into the middle of the current trading range. The move left behind two straight days where sellers seemed to be ready to break the index down only to stumble and fall as buyers rallied the index off its lows for the day.
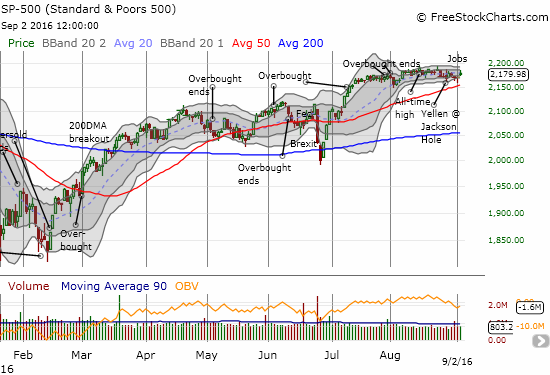
The S&P 500 continues to float along in an ever-extending trading range.
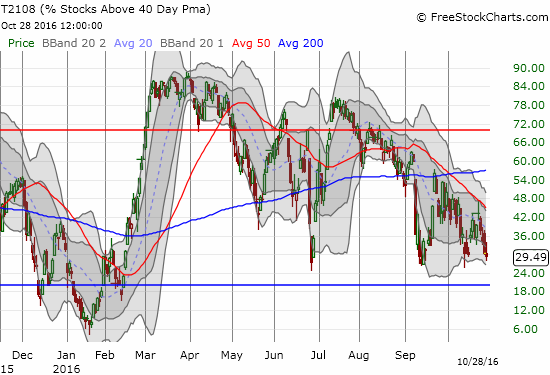
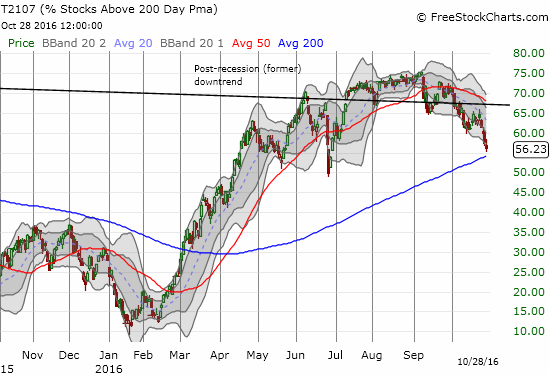
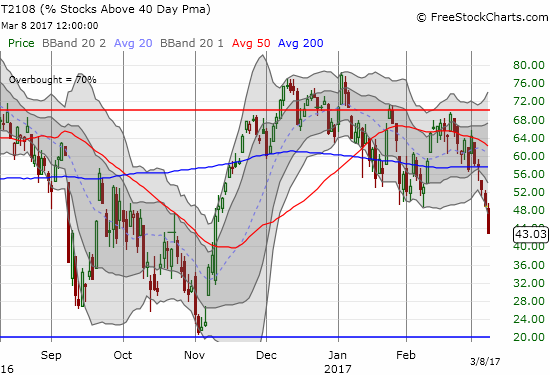
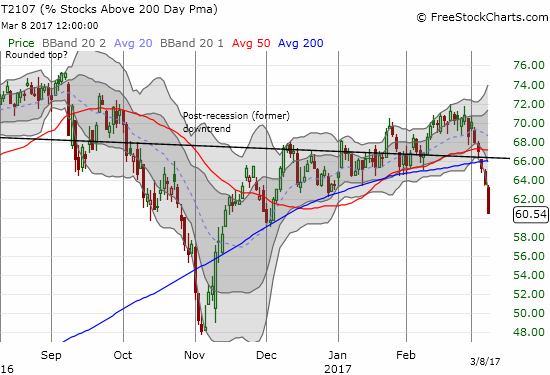
During that time, T2108, the percentage of stocks trading above their respective 40-day moving averages (DMAs), took some serious technical hits. T2108 traded as low as 48.3% on Thursday, September 1, and closed that day at 52.3%. The bearish divergence widened ever further. T2108 closed the week at 57.9%. The good news for bulls and buyers is that, T2107, the percentage of stocks trading above their respective 200DMAs, has remained remarkably calm throughout all this churn. T2107 has drifted within a tight two percentage point range since it recovered from early August’s brief tumble. My short-term trading bias is still cautiously bearish given the earlier described divergence and the tendency for September to deliver the biggest drawdowns of the year.
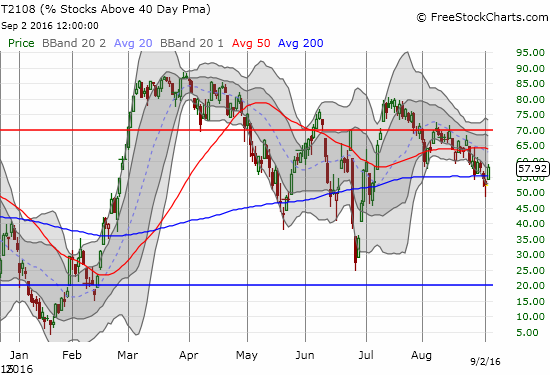
T2108’s downtrend exposes an on-going deterioration of short-term technicals for the general stock market.
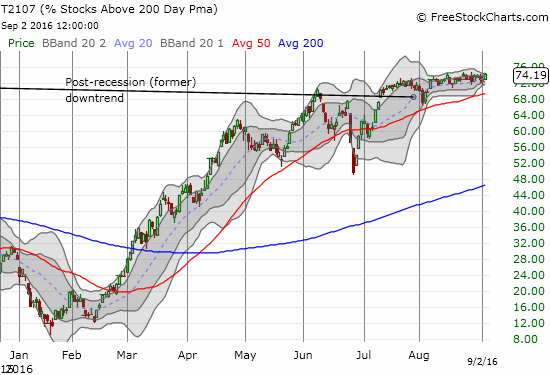
T2107’s steady hand indicates the longer-term health of the stock market remains remarkably intact.
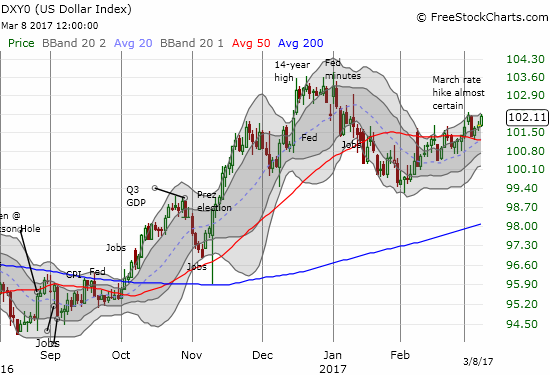
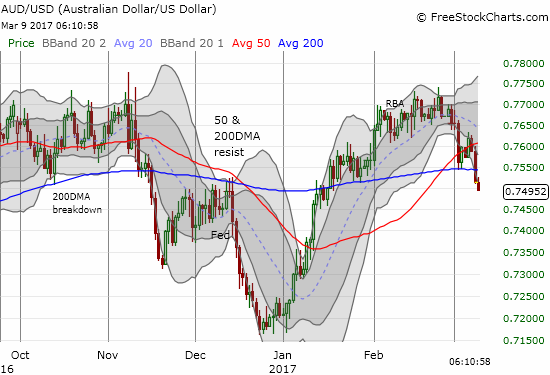
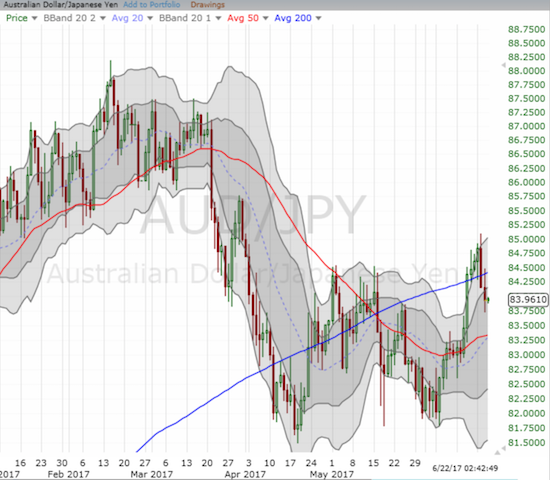
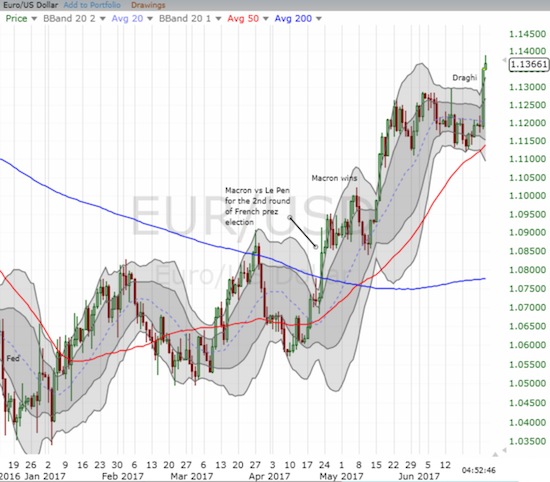
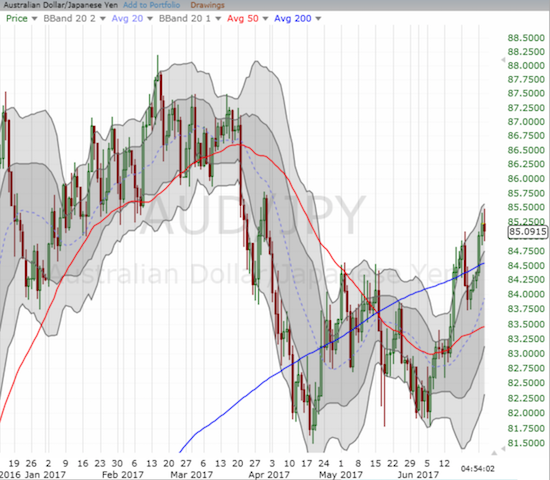
Central bank and OPEC action looks set to dominate the scene for September. This week kicks things off with the Reserve Bank of Australia on September 6th (2:30pm AEST – not long from the time of writing) and the European Central Bank (ECB) on September 8th. As these events roll out, currencies may become the forcing function for stocks. In the meantime, here are some stock charts to consider this week…
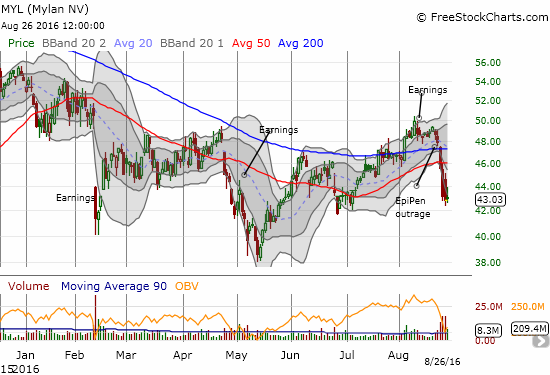
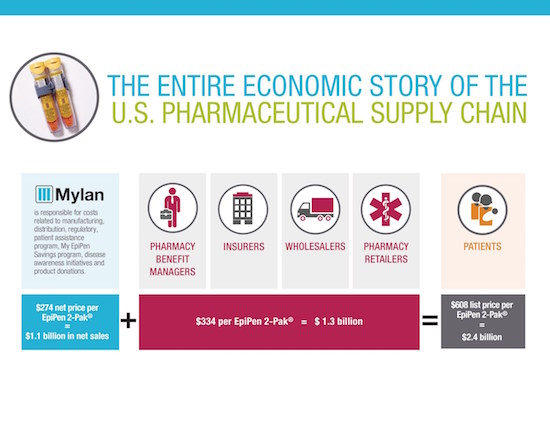
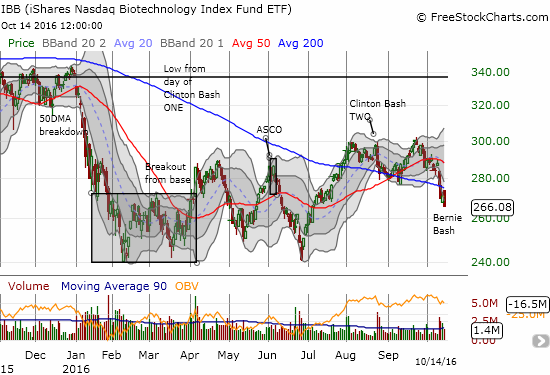
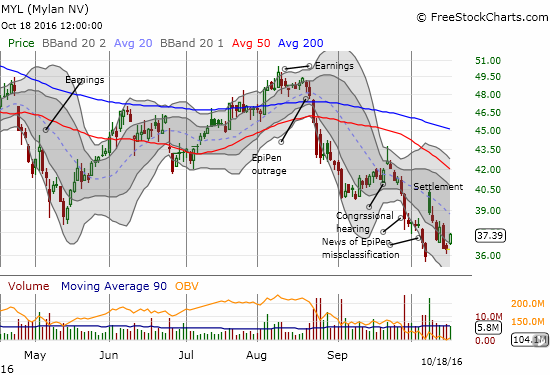
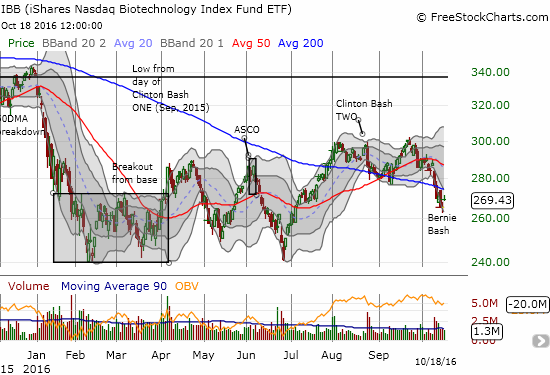
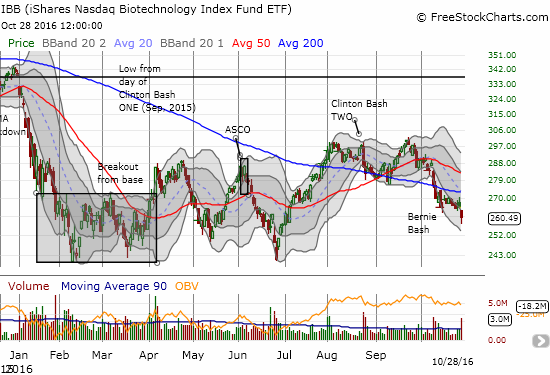
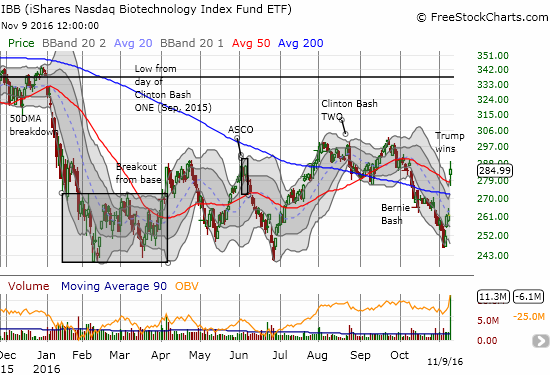
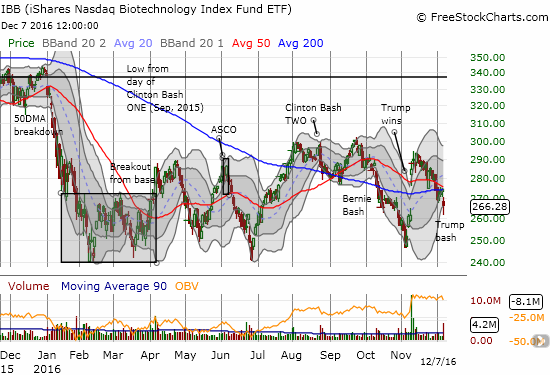
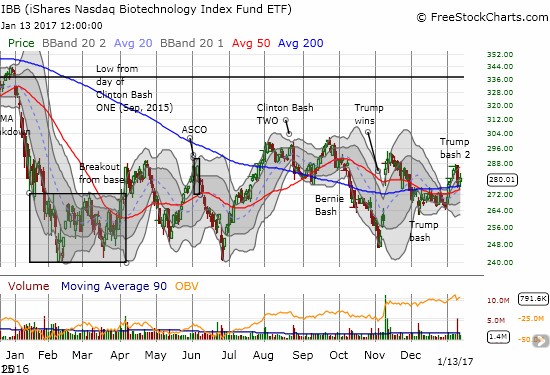
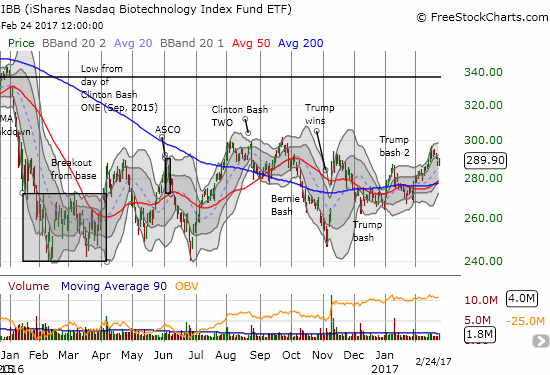
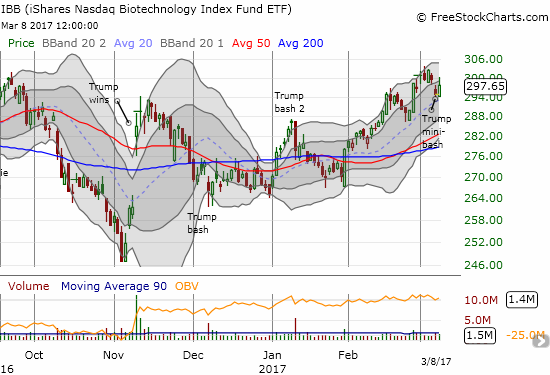
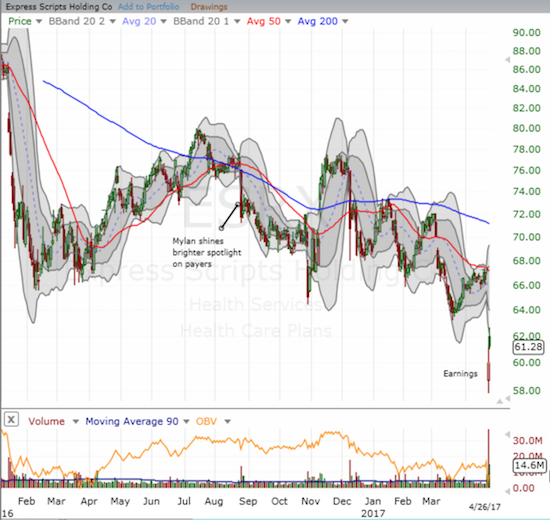
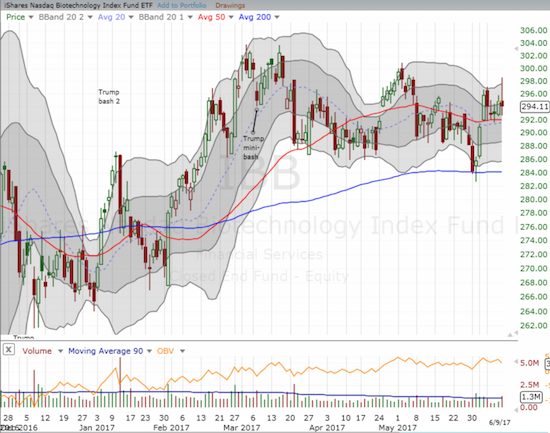
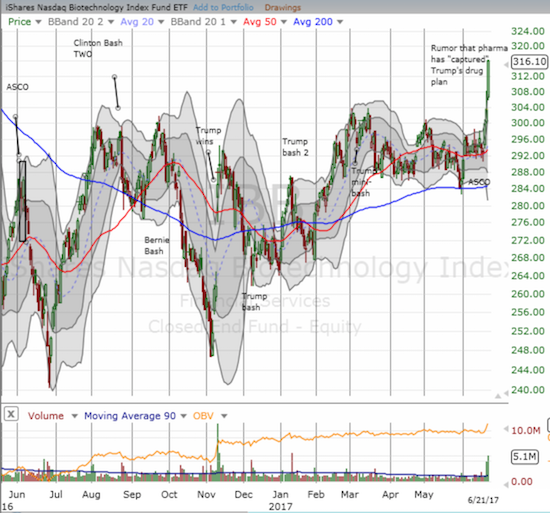
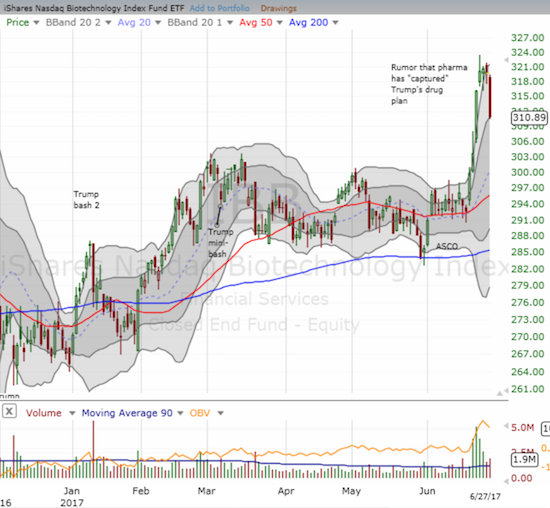
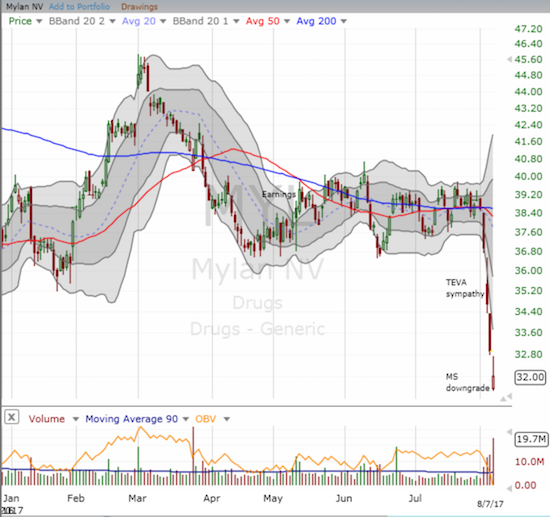
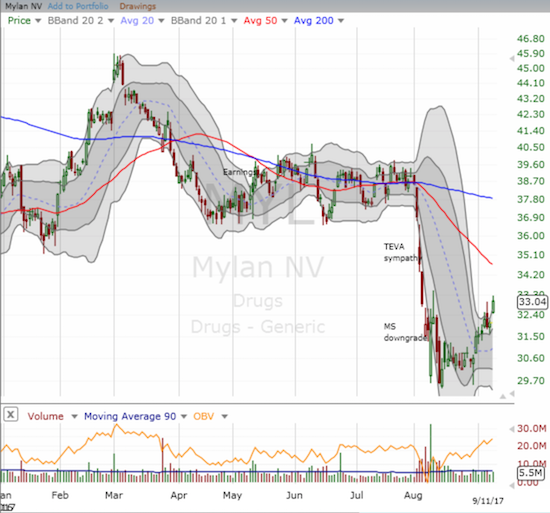
I wrote comprehensively about Mylan NV (MYL) and its EpiPen pricing debacle last week. I predicted further selling ahead and collateral damage for the iShares Nasdaq Biotechnology (IBB). Two-for-two so far although IBB is holding up to the Clinton Bash Part Two a lot better than I expected. Perhaps the market has already priced in its Clinton fears from last year. I hope to soon cover two epinephrine-related companies Impax Laboratories (IPXL) and Adamis Pharmaceuticals (ADMP).
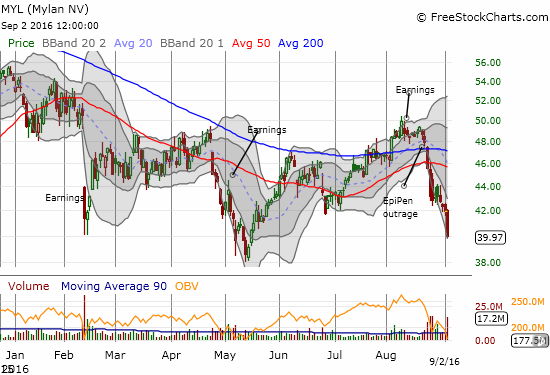
The selling accelerated on Mylan (MYL).
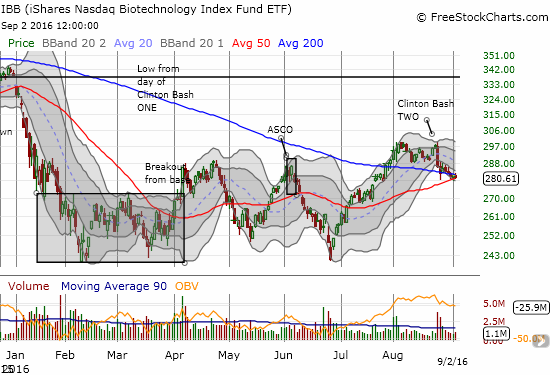
The iShares Nasdaq Biotechnology (IBB) is barely clinging to converged support at its 50 and 200DMAs. One more slip could trigger a cascade of selling pressure.
On Friday, August 26, Nightly Business Report (NBR) featured U.S. Concrete (USCR) as a stock pick from a fund manager. I put the company on my potential buy list but have hesitated given the sudden appearance of high-volume selling. I have yet to find explanatory news, but I have duly noted that the stock is technically a short given how well the 200DMA has held up as resistance. The high-volume selling seems to confirm USCR as a short. I need to see much more constructive action before pulling the trigger for a buy at some point in the future.
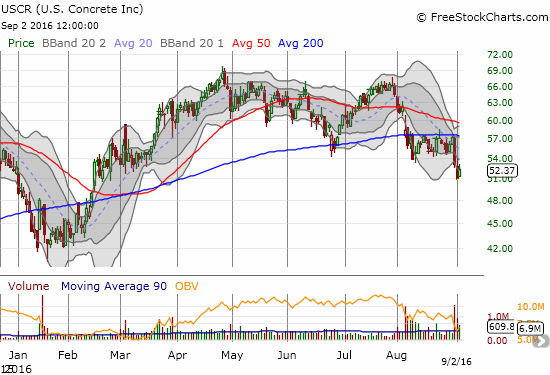
Since an early August gap down, sellers and resistance have dominated the action on U.S. Concrete (USCR). It looks like a don’t buy/sell/short here.
Start at the 15:57 mark…
Tableau Software (DATA) has erased about half of its big gain from August 23rd. This looks like a classic “calm after the storm” trade setup. Although I am bearish on the stock market, I am keeping an eye on this setup. If it fails, I might short DATA in anticipation of a complete gap fill and/or retest of 50DMA support. (See earlier T2108 Update for description of previous setup on DATA).
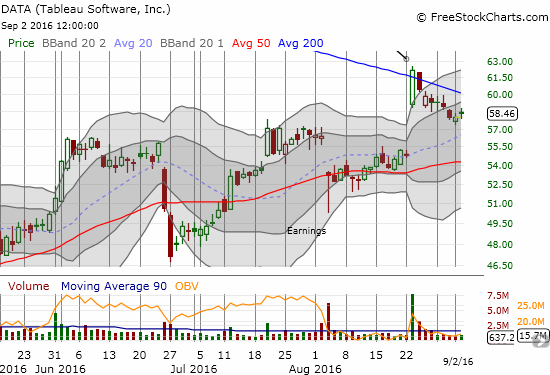
Buyers have yet to follow-through on the big gap up for Tableau Software (DATA), but the selling is drifting and non-committal. A return of buyers could lead to a swift resumption of momentum or a continued absence of buyers could motivate more determined selling.
About a month ago, I concluded that the Teucrium Corn ETF (CORN) would continue to sell-off. After a brief pop, CORN did indeed set new all-time lows. Buyers returned over the past two days, and CORN is looking interesting again. I will stay patient and wait to see whether the ETN can even manage to a close above 50DMA resistance before I consider any kind of purchase. Readers recall that I typically exempt commodities from my general stock market trading call since they can be uncorrelated to stock market returns.
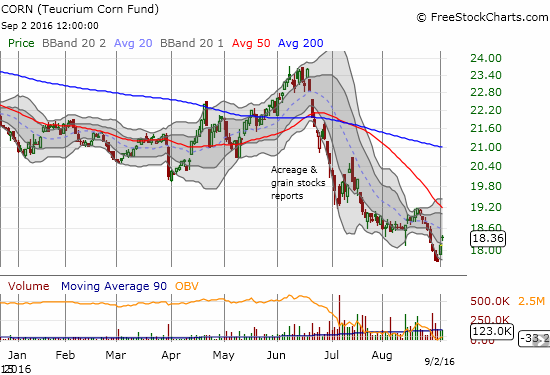
Sellers have placed intense pressure on Teucrium Corn ETF (CORN). Can buyers sustain the latest bounce?
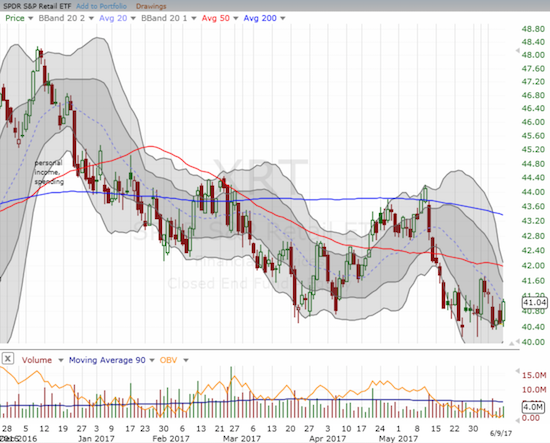
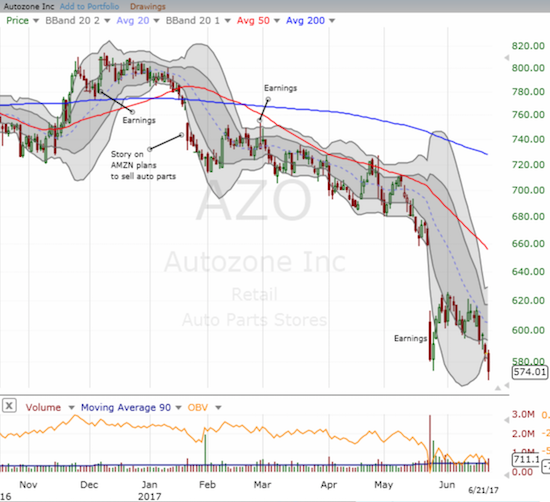
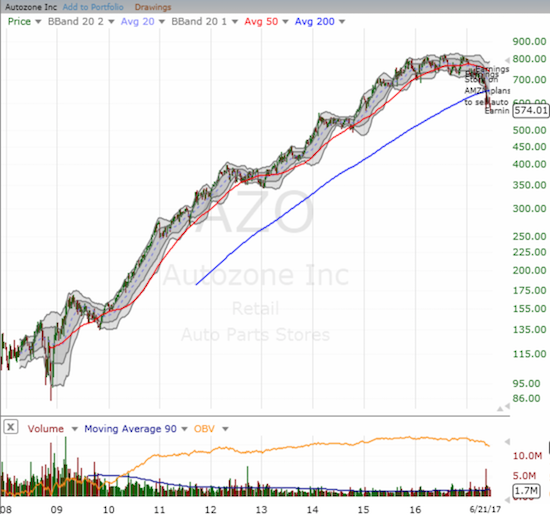
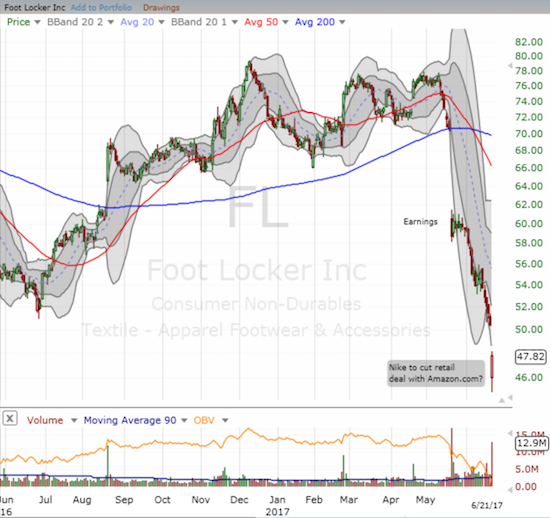
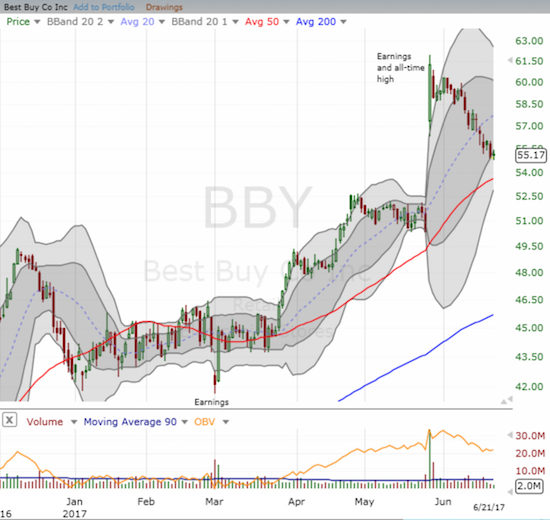
The earlier contrary excitement over retailers has cooled off and even reversed in many cases. Macy’s (M) led the way by cratering through its 200DMA. The stock is now trying an important bounce from 50DMA support. The SPDR S&P Retail ETF (XRT) is also trying to find support at its 50DMA. If I were not bearish, I would look to buy XRT here. Instead, I am watching for a breakdown to sell. JC Penney is also testing important 50DMA support. The stock was a big undervalued pick by the fund manager on NBR August 26th: “I’m telling you, this is one of the biggest turnaround stories I have come across in my 30 years.”
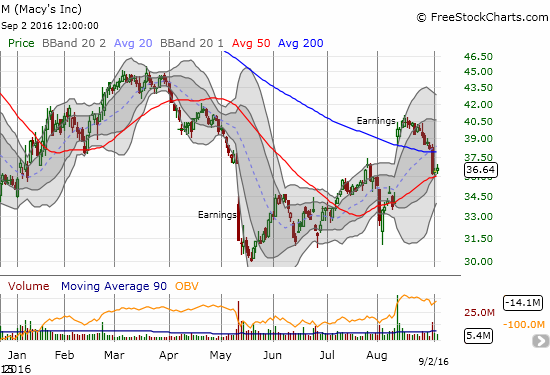
The bad news is good news trade looks just about over for Macy’s (M). Can buyers defend support at the 50DMA?
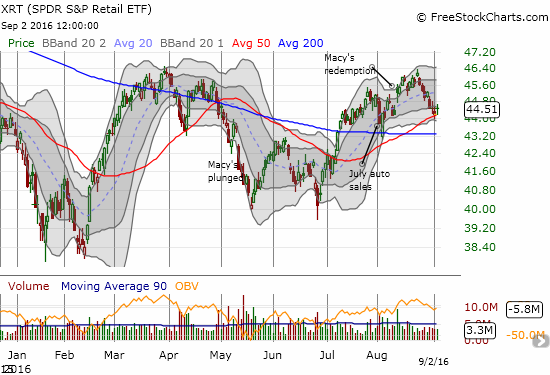
The SPDR S&P Retail ETF (XRT) is also trying to hold support at its 50DMA. However a double-top for 2016 may already be a lock.
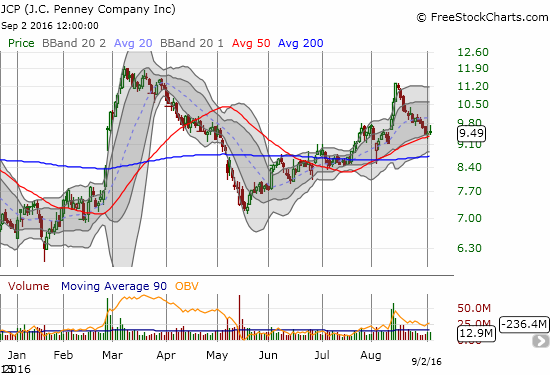
Imagine that – JC Penney Company (JCP) is also testing critical 50DMA support.
The Hain Celestial Group, Inc. (HAIN) broke down to a new post-earnings warning low and is now a short. (9/6 correction: HAIN gapped down on an earnings warning. Chart will be corrected going forward).
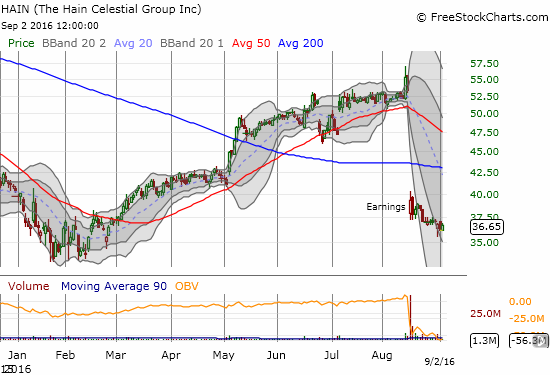
The Hain Celestial Group, Inc. (HAIN) is breaking down in the “open field.” A retest of 2016’s low is in play.
Twitter (TWTR) survived a test of 200DMA support. The stock now looks ready to overwhelm the two sell ratings that smacked it off its last perch.
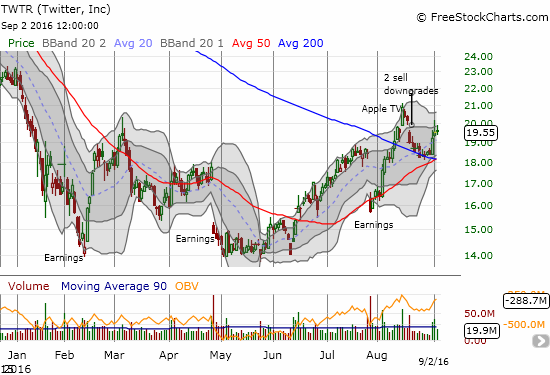
Twitter (TWTR) rebounds off 200DMA support. Can it “defeat” the 2 recent sell ratings?
Post-earnings sellers in Palo Alto Networks (PANW) stopped neatly at 50DMA support. Buyers took over from there. They rushed right into the gap but now face 200DMA resistance. Which is it? Were earnings bad or good?
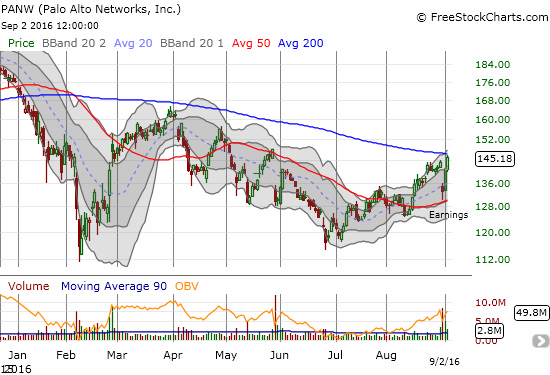
Palo Alto Networks (PANW) is struggling to regain its former luster as an unstoppable stock. Resistance at its 200DMA may be the ultimate dividing line between breakout and resignation.
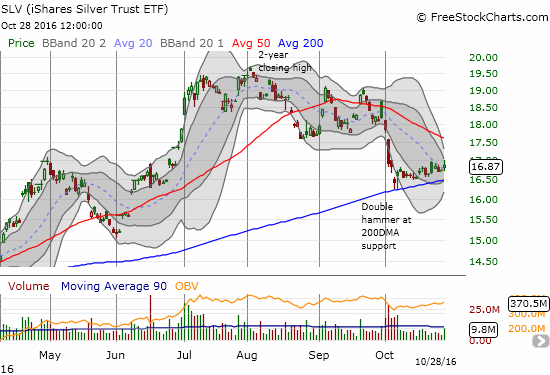
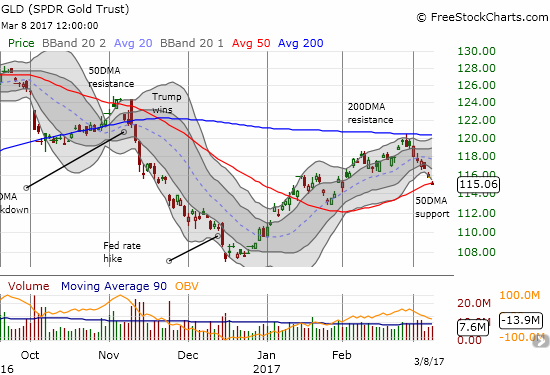
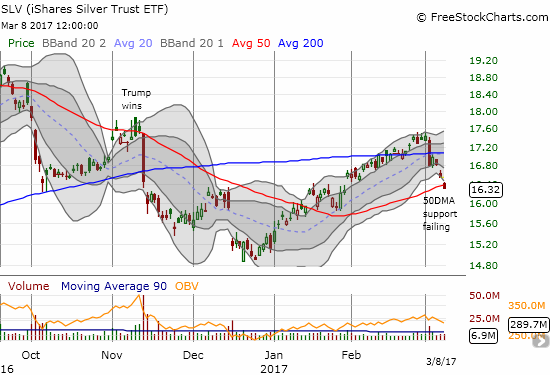
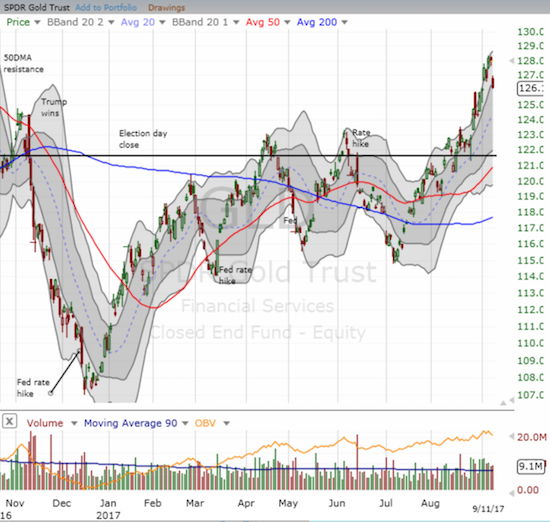
One final trading note, I sold my call options in the iShares Silver Trust (SLV) as part of a hedged trade for last week. The precious metals did not move nearly as much as I had hoped (open or down). The profits from the SLV call options cover most of the cost of my call options on ProShares UltraShort Silver (ZSL). If SLV manages to breakout above 50DMA resistance, I will likely jump right back into call options and get much more aggressive.
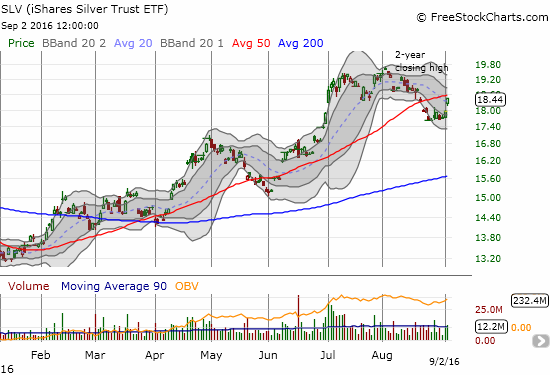
The iShares Silver Trust (SLV) springs back to life and makes a challenge for 50DMA resistance.
— – —
Daily T2108 vs the S&P 500
")
Black line: T2108 (measured on the right); Green line: S&P 500 (for comparative purposes)
Red line: T2108 Overbought (70%); Blue line: T2108 Oversold (20%)
Weekly T2108

*All charts created using freestockcharts.com unless otherwise stated
The charts above are the my LATEST updates independent of the date of this given T2108 post. For my latest T2108 post click here.
Related links:
The T2108 Resource Page
Be careful out there!
Full disclosure: long SDS, long UVXY shares, long MYL puts, long IBB puts, long HAIN puts, short TWTR puts, long SLV, long ZSL puts