AT40 = 58.6% of stocks are trading above their respective 40-day moving averages (DMAs)
AT200 = 58.5% of stocks are trading above their respective 200DMAs
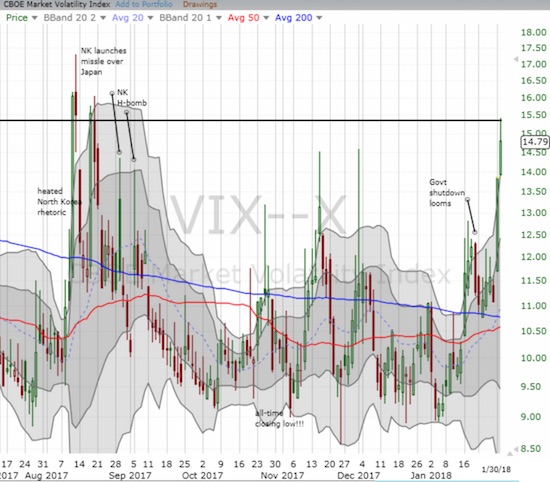
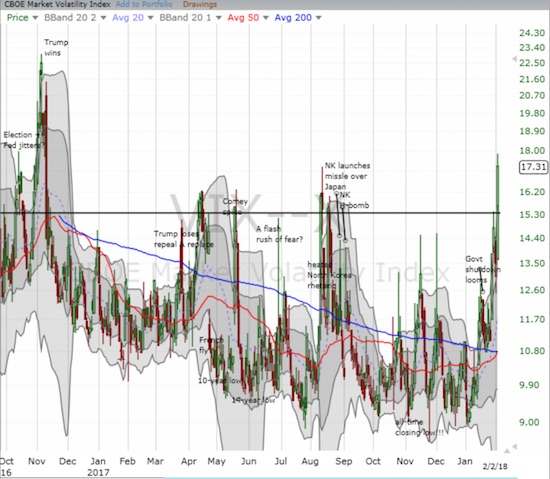
VIX = 10.7 (volatility index) (intraday high of 12.11)
Short-term Trading Call: cautiously bullish
Commentary
It seemed poetic. The Golden State Warriors, hailing from the tech heavy San Francisco Bay Area, were beaten suddenly, thoroughly, abruptly, and relentlessly off a sky-high sugar high (a very convincing 3 games to none lead in the 2017 NBA finals). So were tech stocks.
LEBRON JAMES REALLY DID THIS IN THE NBA FINALS pic.twitter.com/PsXfQC2k0a
— Yahoo Sports (@YahooSports) June 10, 2017
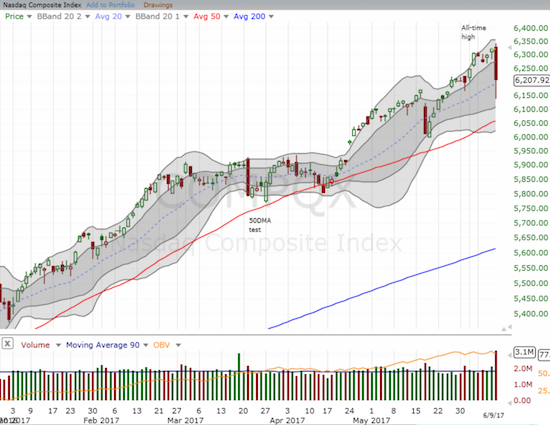
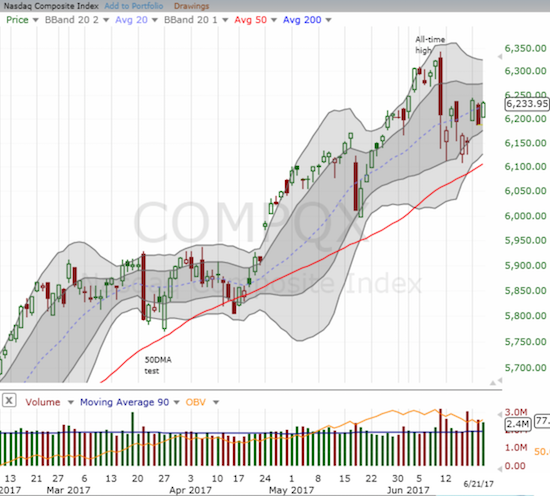
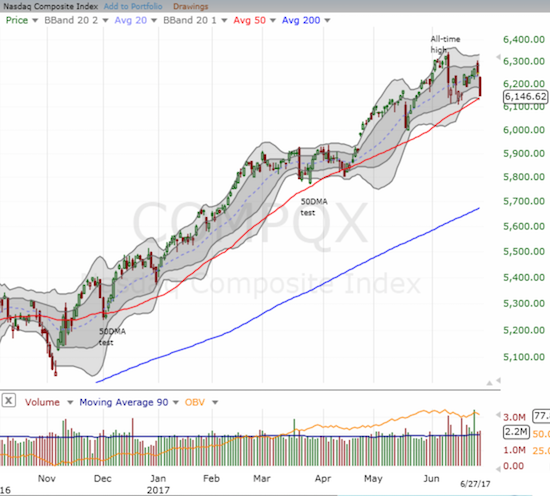
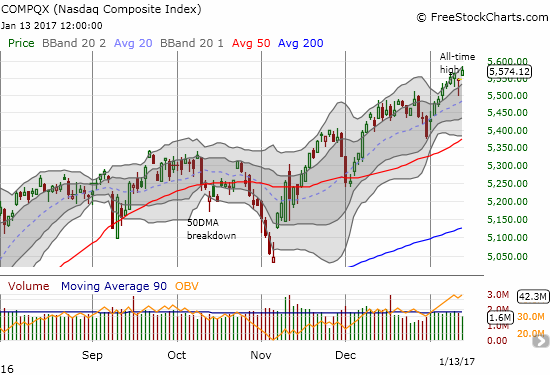
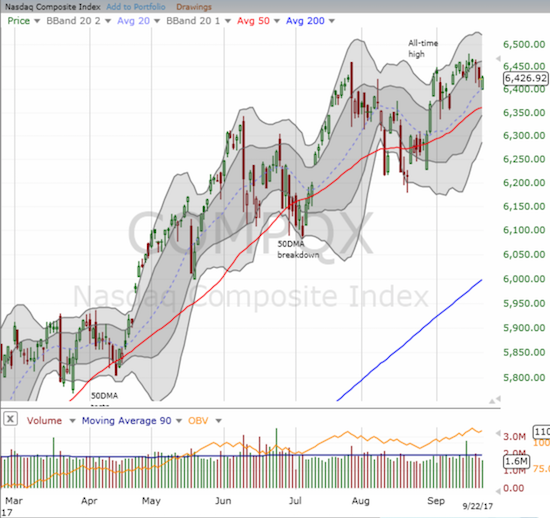
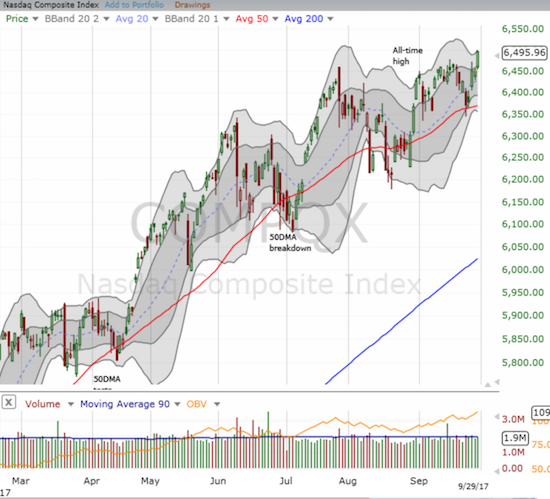
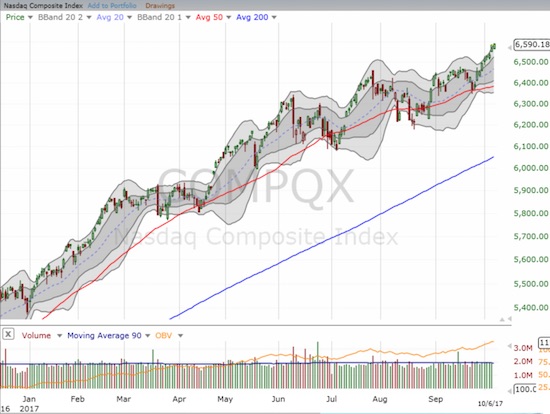
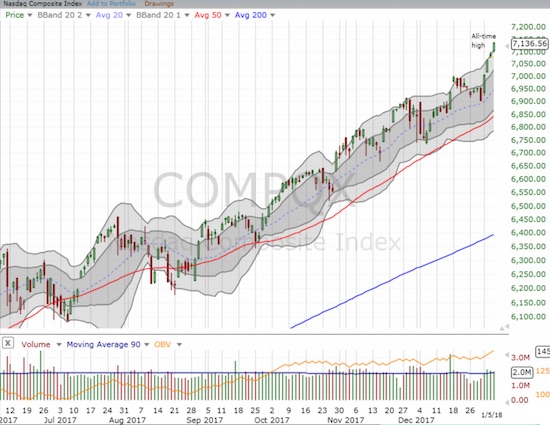
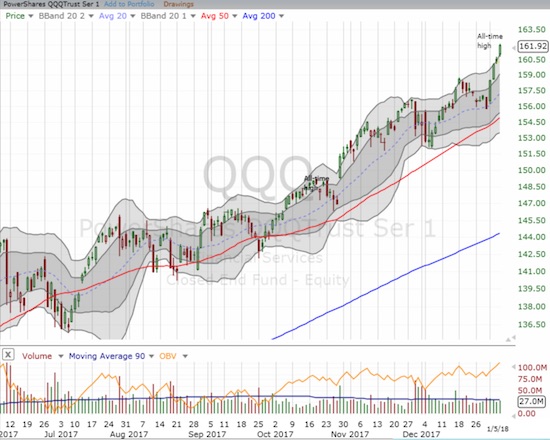
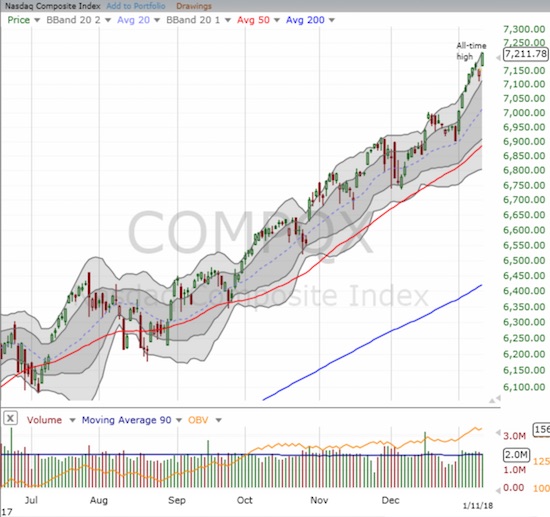
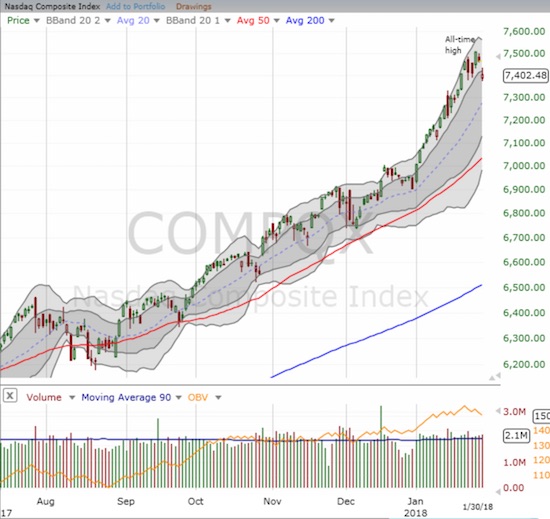
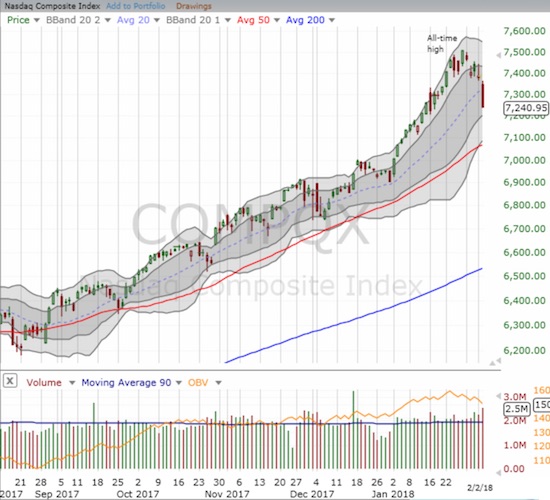
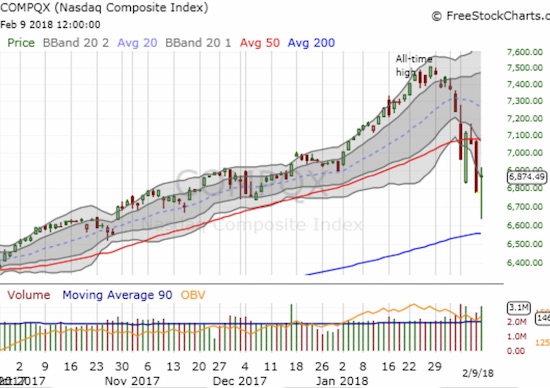
The NASDAQ took a serious shellacking just one day after confirming a bullish undercurrent for the market with another all-time high.
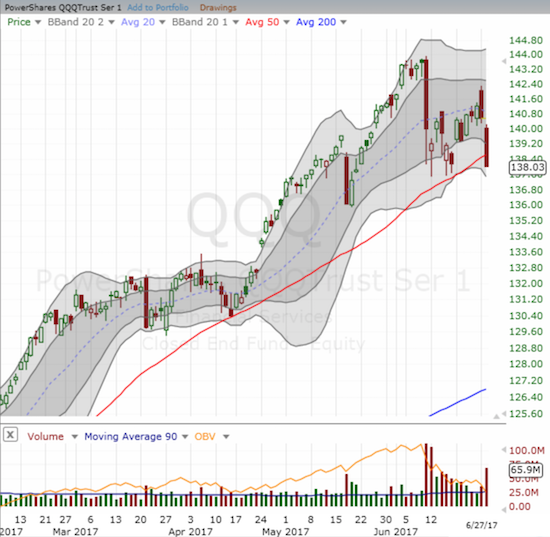
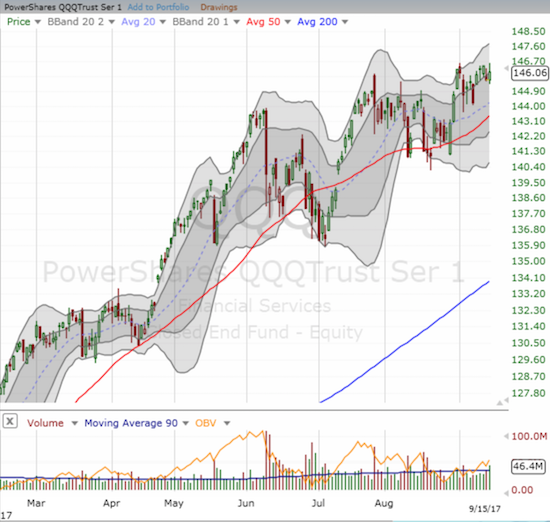
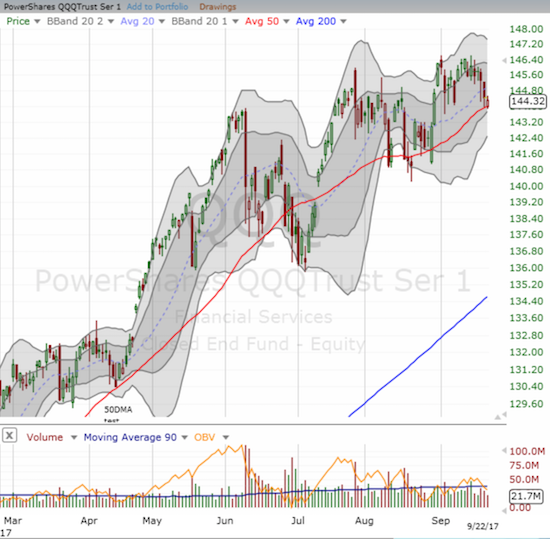
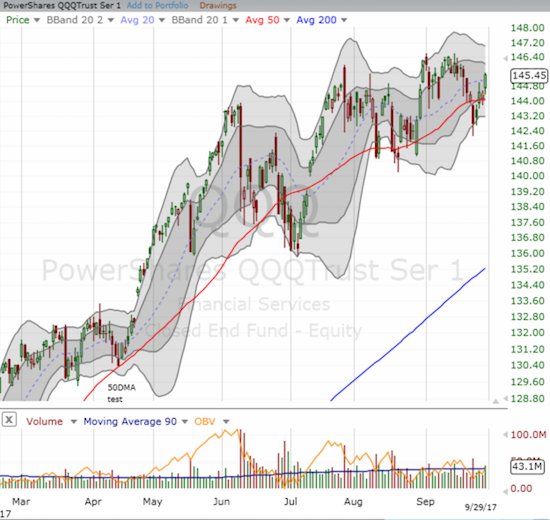
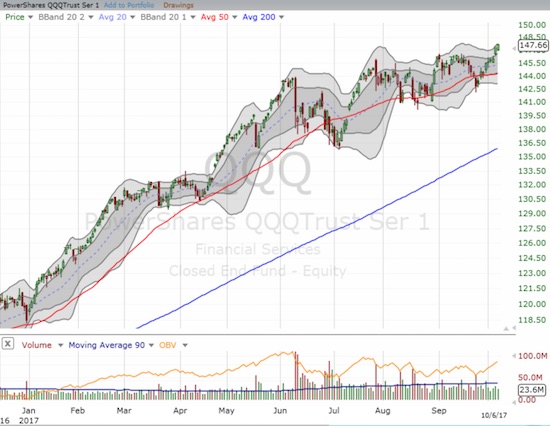
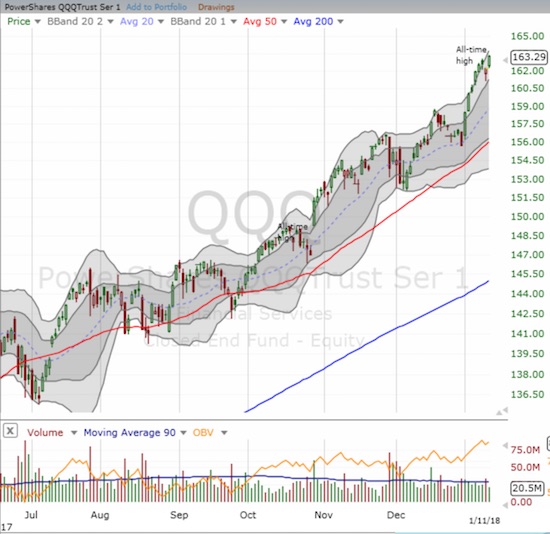
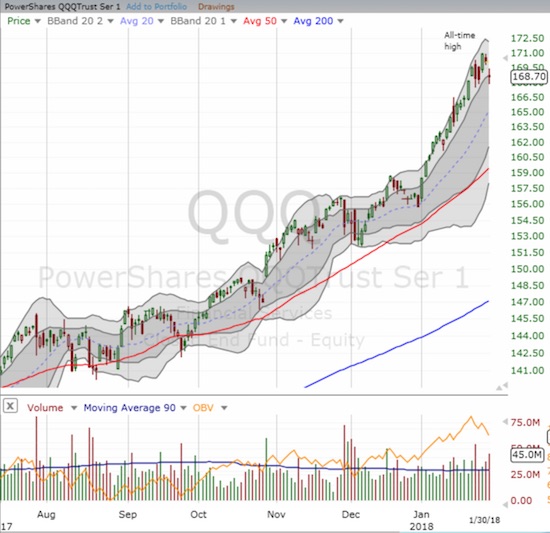
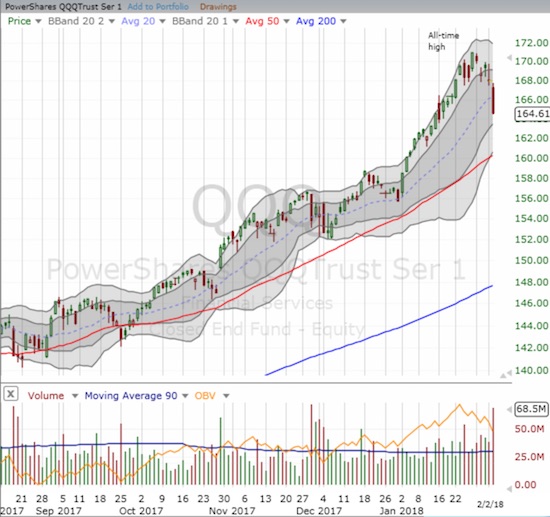
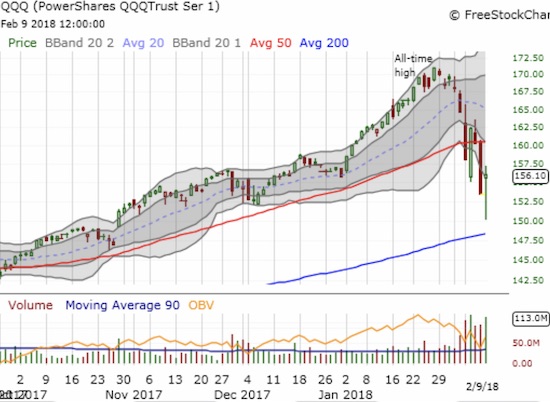
While the carnage in big cap tech stocks was painfully clear – the PowerShares QQQ ETF (QQQ) declined 2.5% and the NASDAQ Composite declined 1.8% – most of the remaining stock universe was blissfully unaware of the pain.
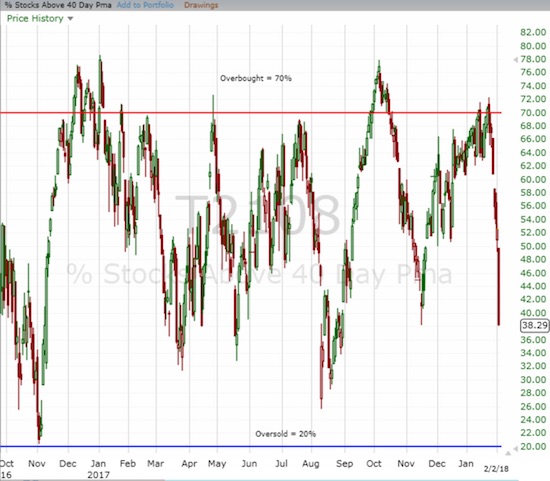
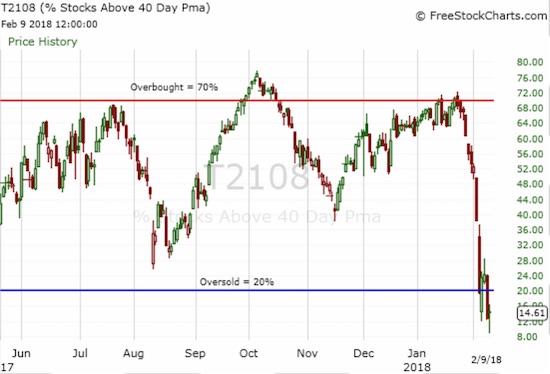
My favorite technical indicator, AT40 (T2108), the percentage of stocks trading above their respective 40-day moving averages (DMAs), says it all. AT40 increased a solid 6.5 percentage points from 52.1% to 58.6%.
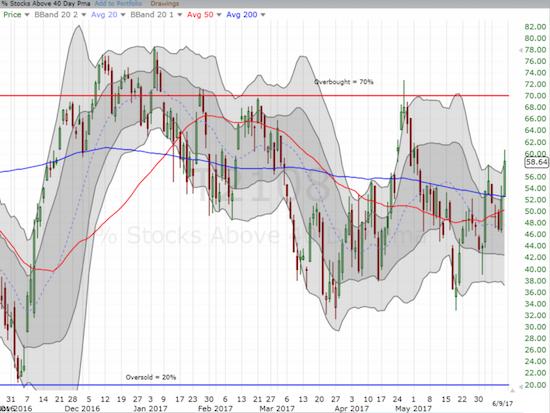
AT40 (T2108) ignored the carnage in big cap tech and soared to a new 5 week high. AT40 looks much healthier now.
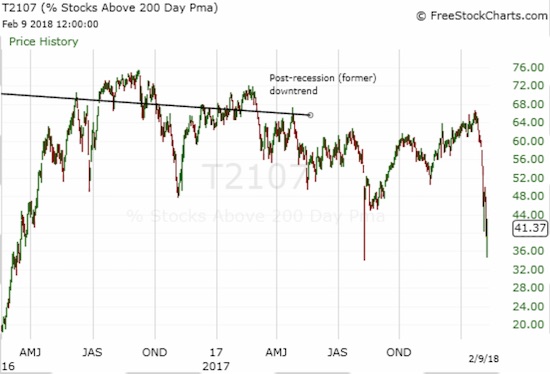
Even AT200 (T2107), the percentage of stocks trading above their respective 200DMAs, confirmed the rally in most everything else not related to big cap tech. T2107 gained 3 percentage points to close at 58.5%.
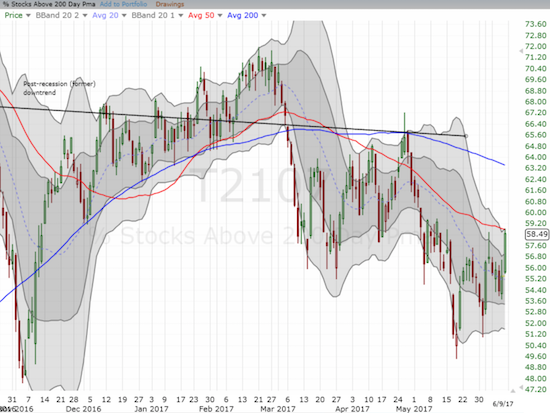
AT200 (T2107) is on the edge of erasing the previous breakdown.
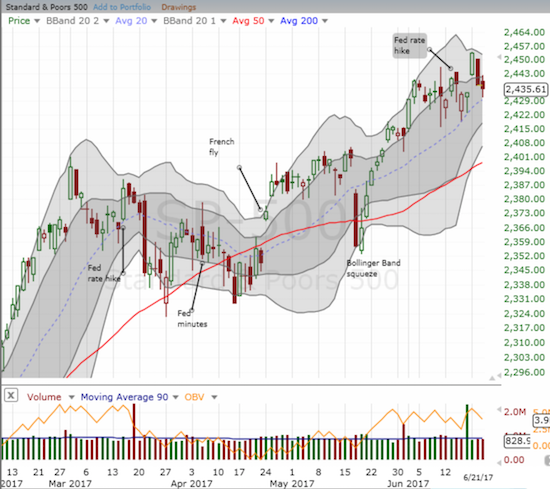
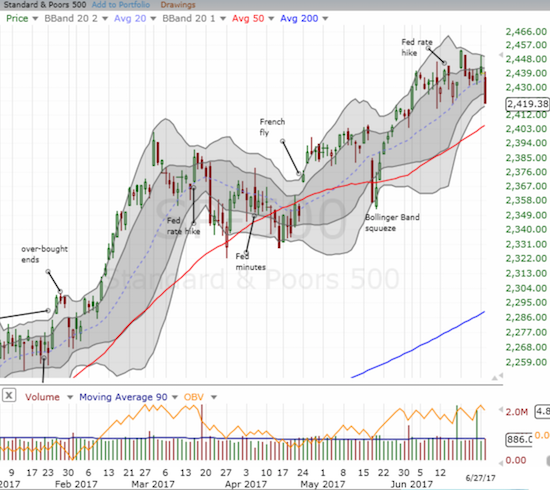
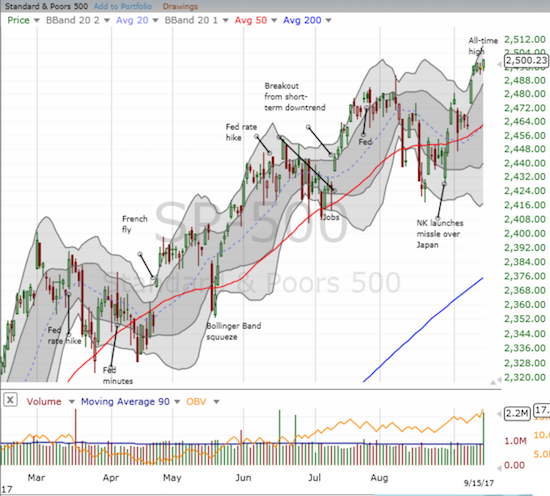
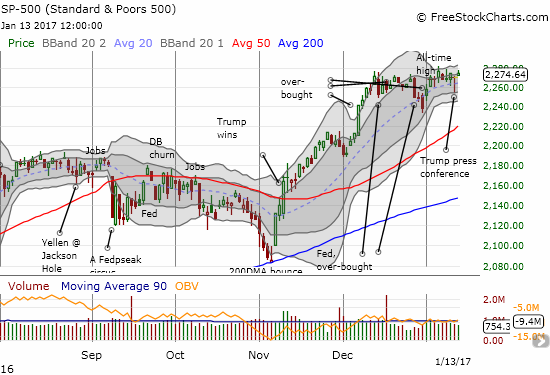
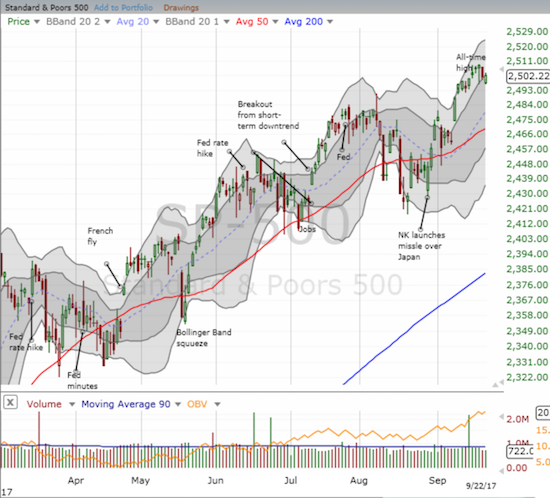
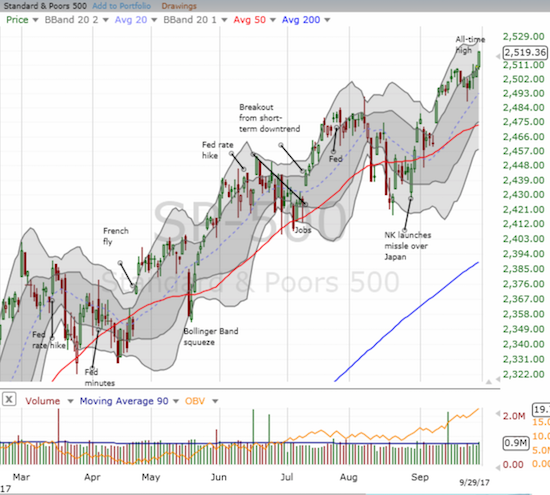
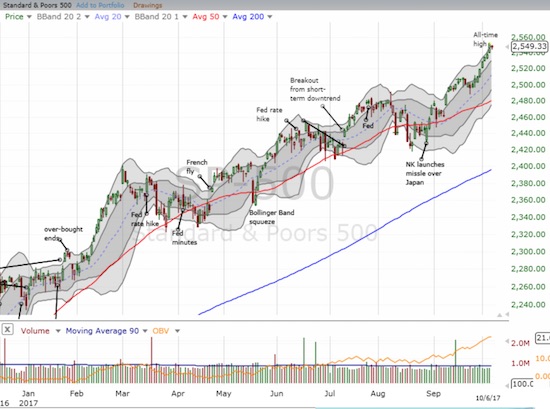
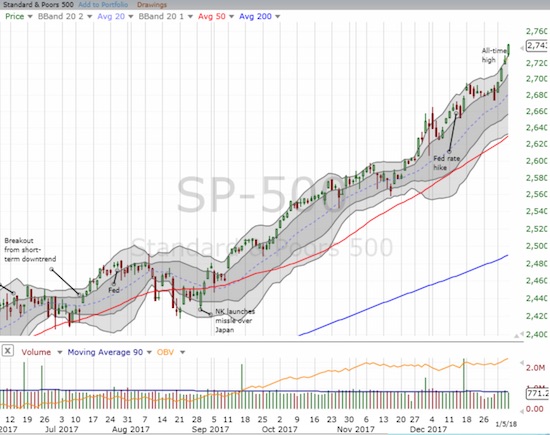
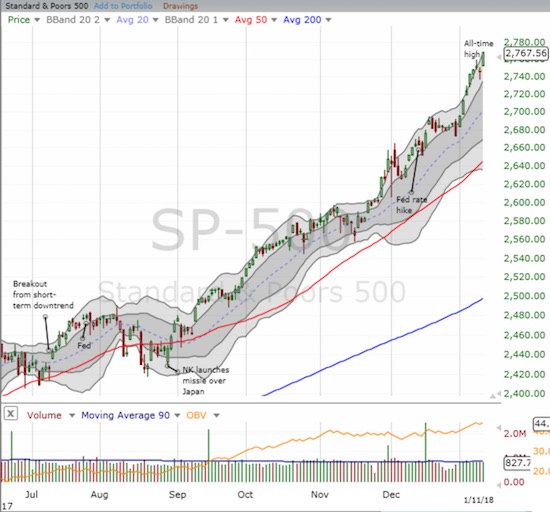
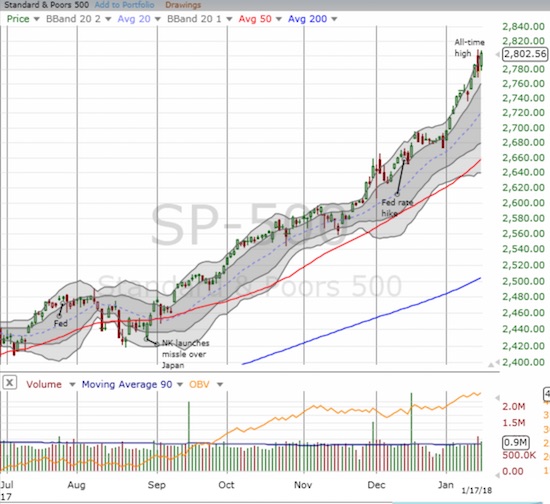
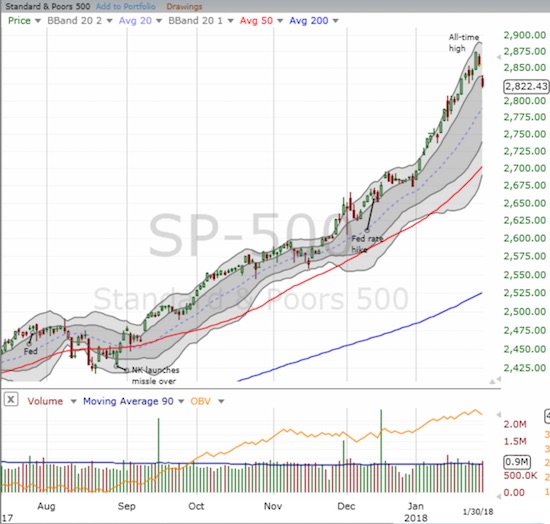
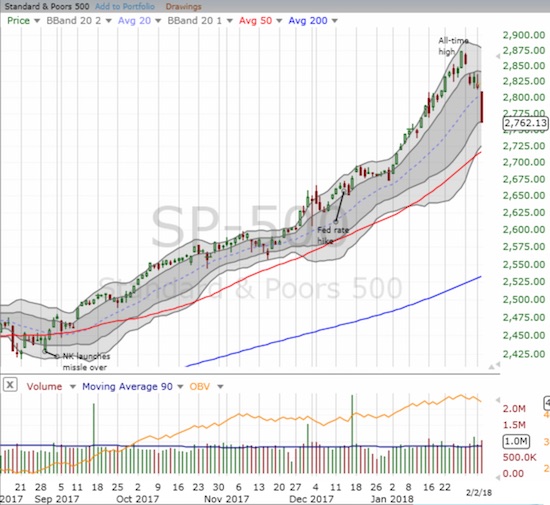
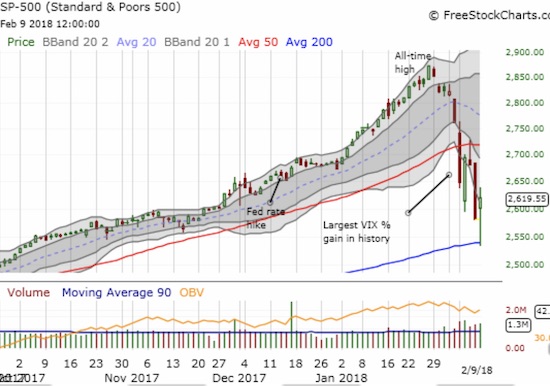
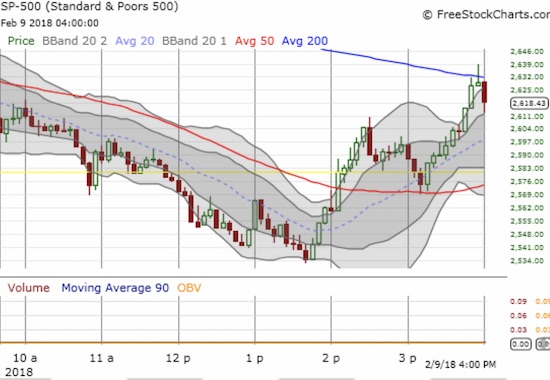
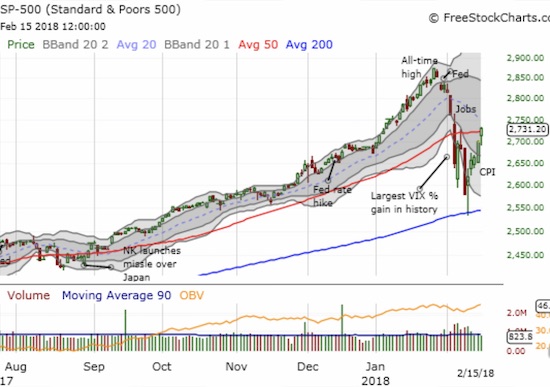
The S&P 500 (SPY) did its part to offset tech weakness by holding its ground with a flat close. The index even gave up an opening rally to a new all-time. At the lows, the S&P 500 erased all the gains from last week’s breakout. It was a wild swing.
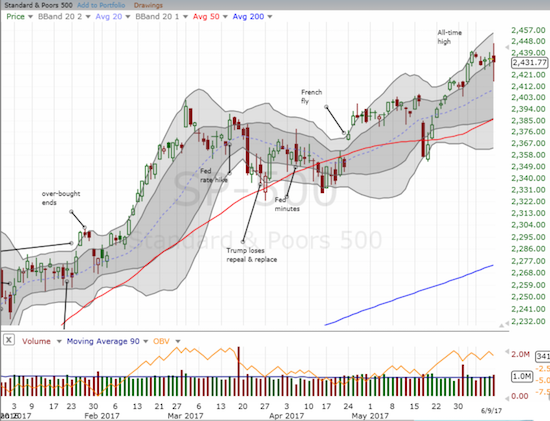
The S&P 500 (SPY) wavered from a new all-time high to a full reversal of last week’s breakout before settling at flat on the day.
Given the divergence between tech and the rest of the market, I decided to take a look at the PowerShares S&P 500 Low Volatility ETF (SPLV) versus the PowerShares S&P 500 High Beta ETF (SPHB). I was quite surprised to see that the High Beta crew has struggled all year to regain traction. Meanwhile, SPLV broke out to a new all-time high on May 22 and has rallied ever since. In previous posts on these ETFs, I have argued that a rally built on the success of the relatively sedate SPLV alone is a short-lived one. Clearly that is not the case here!
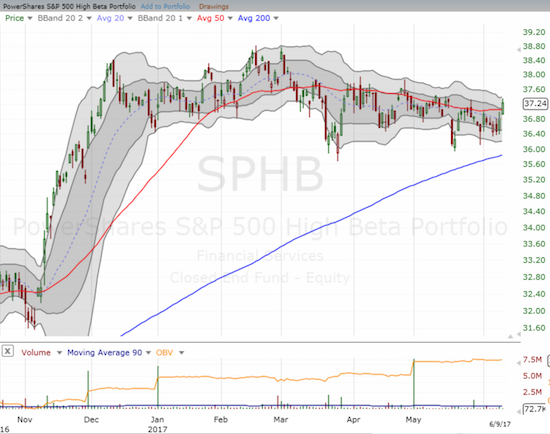
The PowerShares S&P 500 High Beta ETF (SPHB) has gone absolutely nowhere this year…
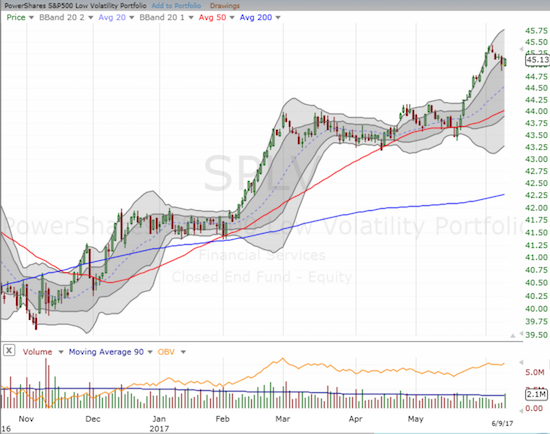
…While the PowerShares S&P 500 Low Volatility ETF (SPLV) has enjoyed a particularly strong 2017 with two big breakouts.
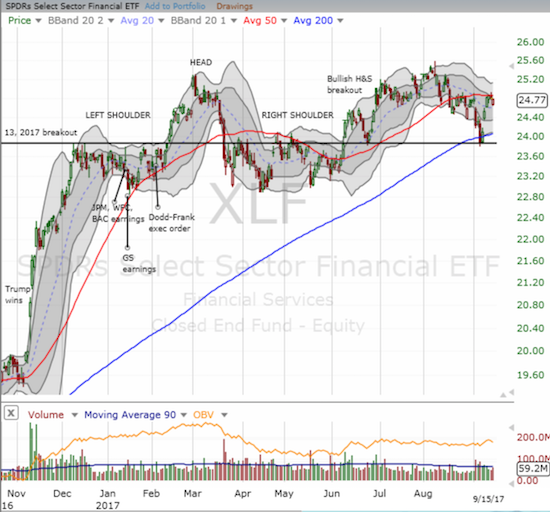
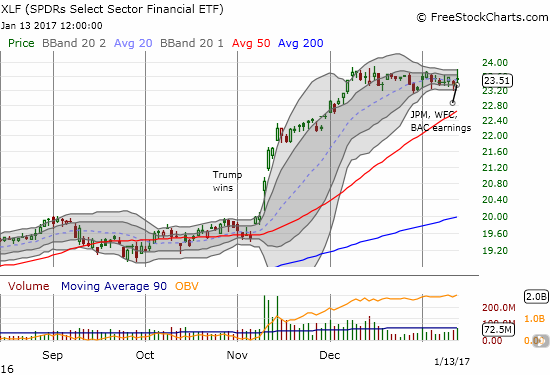
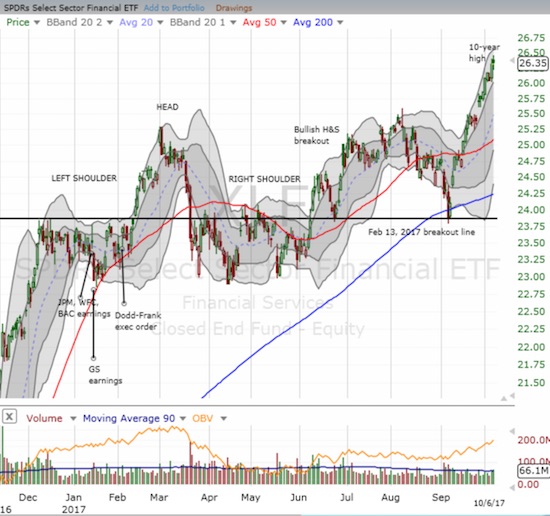
While the S&P 500 performed relatively much better than the NASDAQ, the source of market bullishness came from smaller stocks and specific sectors. The strength in the market showed up in several indices: small-caps (IWM), mid-caps (MDY), even retailers (XRT). Most importantly, the financials (XLF) broke out and invalidated the bearish head and shoulders (H&S) pattern I have been watching (which continues a rich tradition of H&S failures).
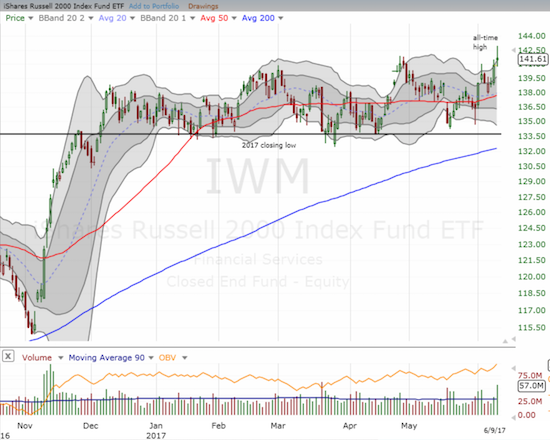
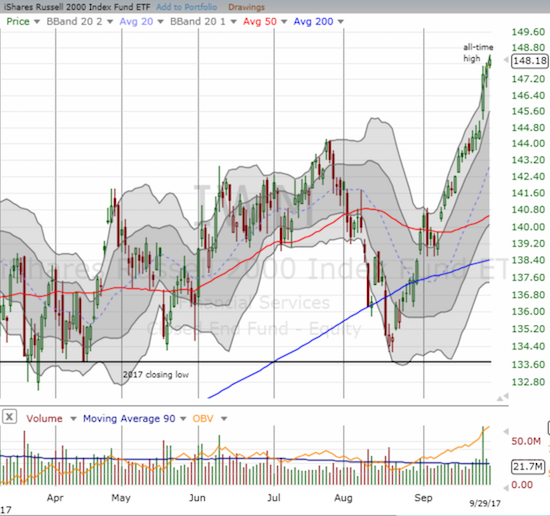
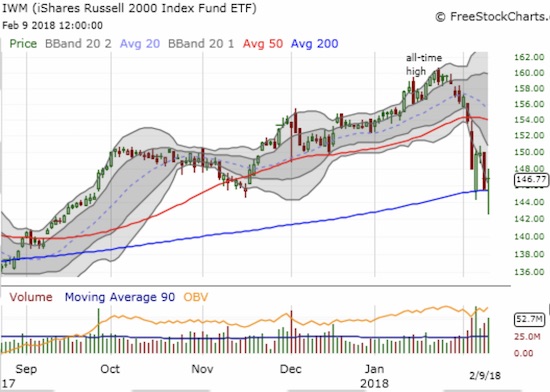
The iShares Russell 2000 (IWM) hit a (marginal) new all-time high. IWM is on the verge of confirming a very bullish breakout from an entire 2017 of bouncing around a trading range.
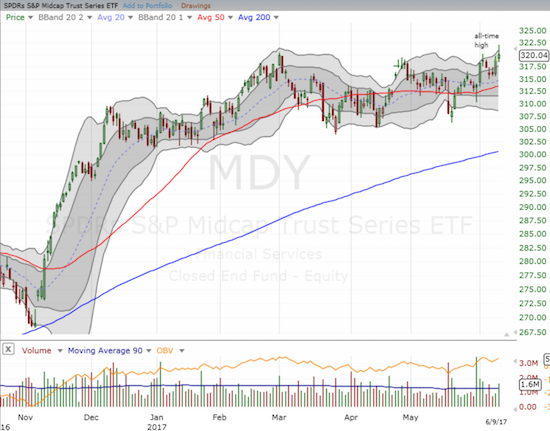
The SPDR S&P MidCap 400 ETF (MDY) is like IWM except its trading range has had an ever so slight upward tilt.
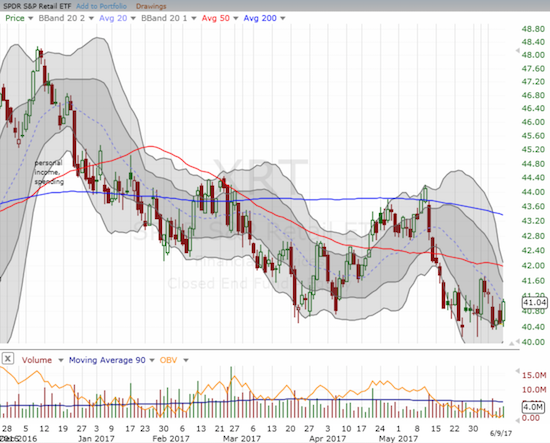
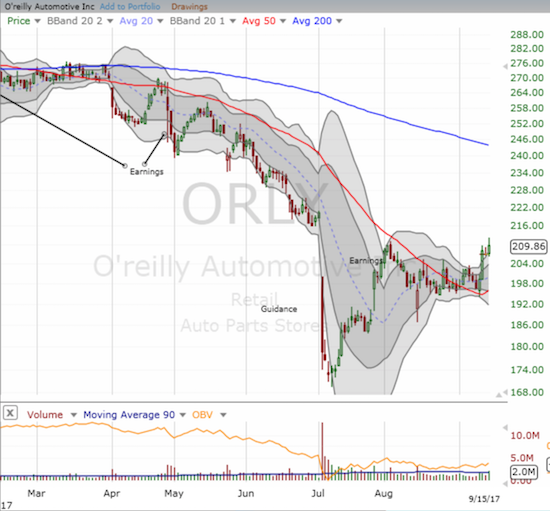
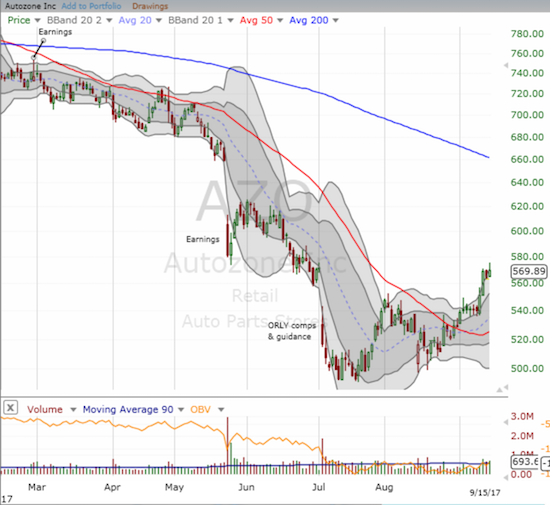
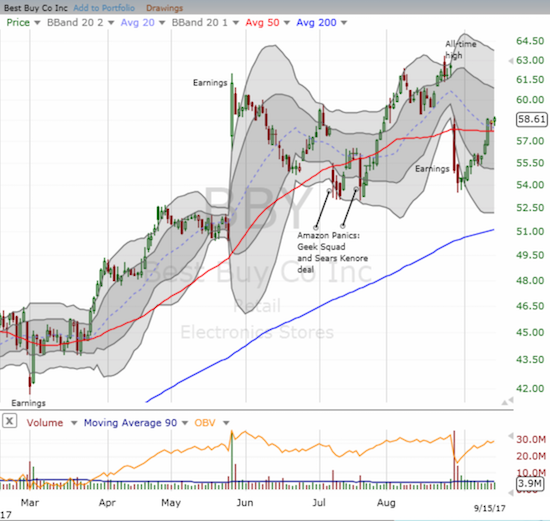
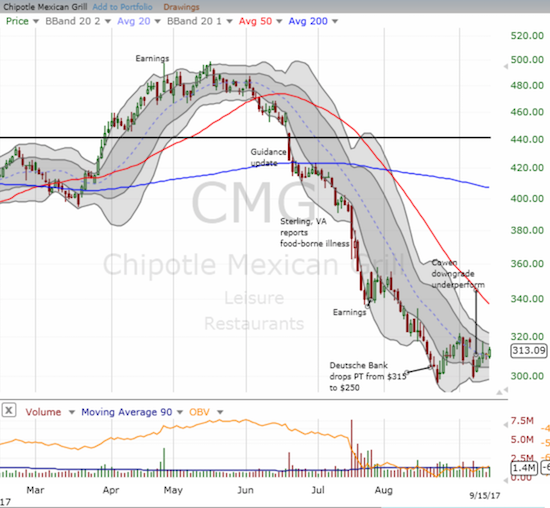
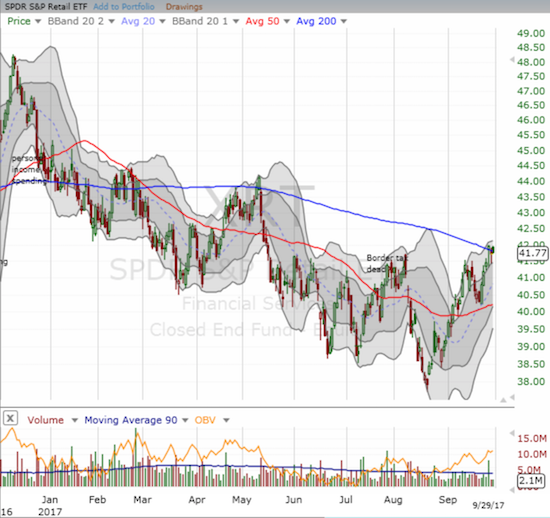
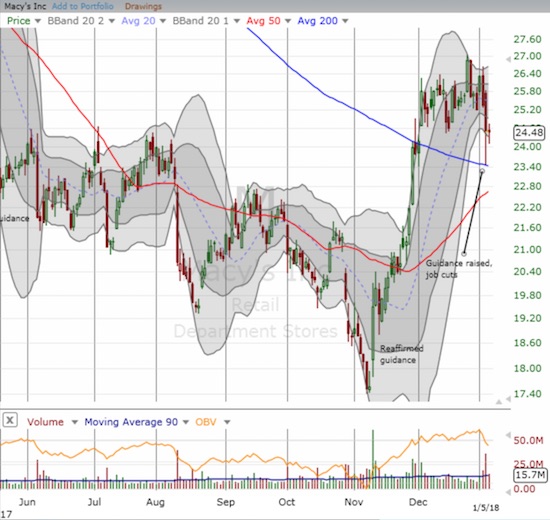
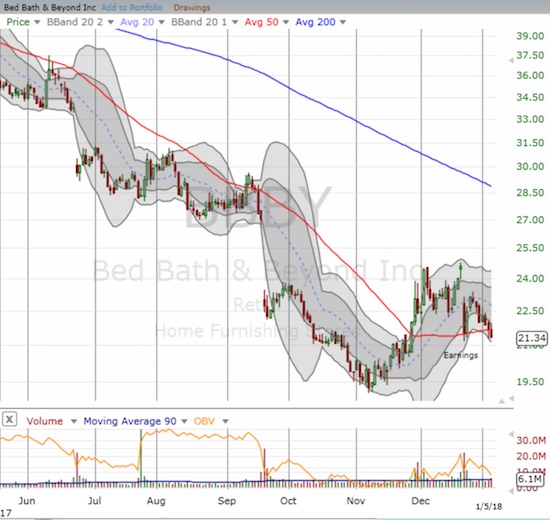
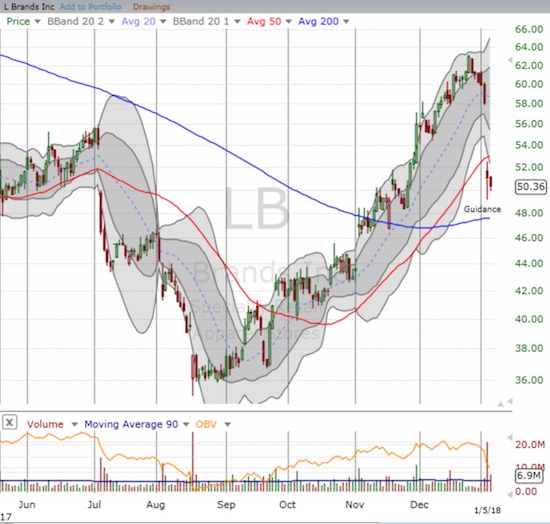
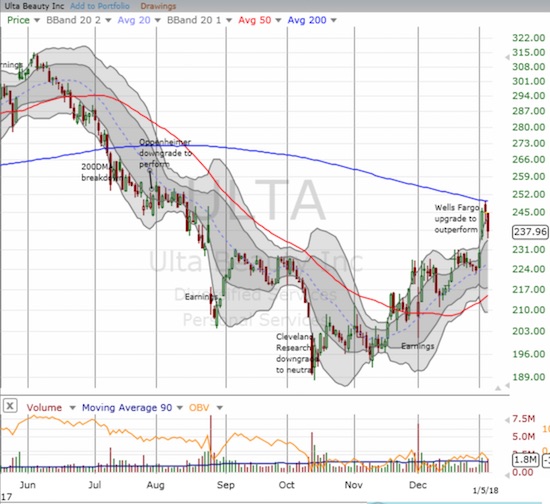
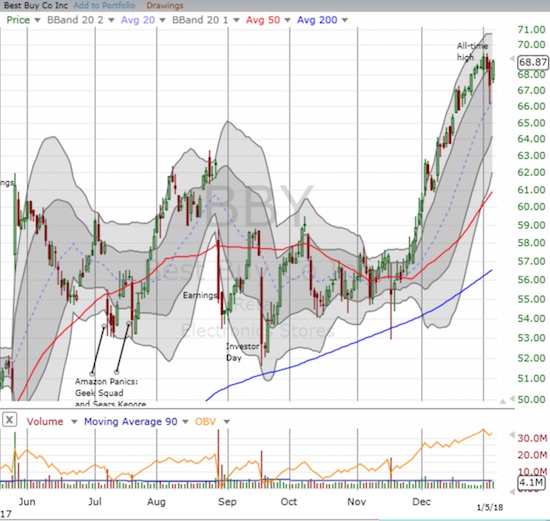
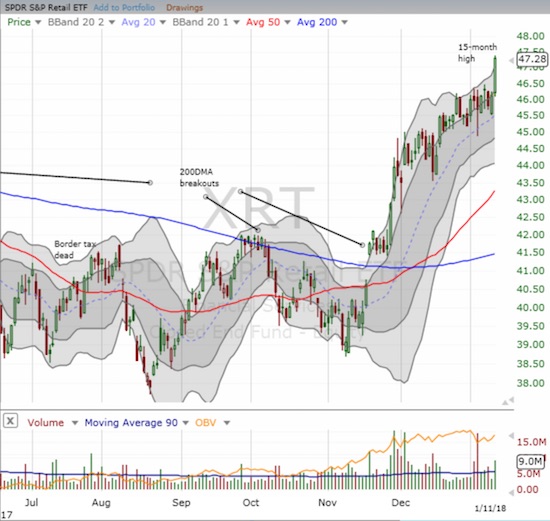
The SPDR S&P Retail ETF (XRT) soaked up the interest of value shoppers. It rallied off recent lows with a 1.4% gain.
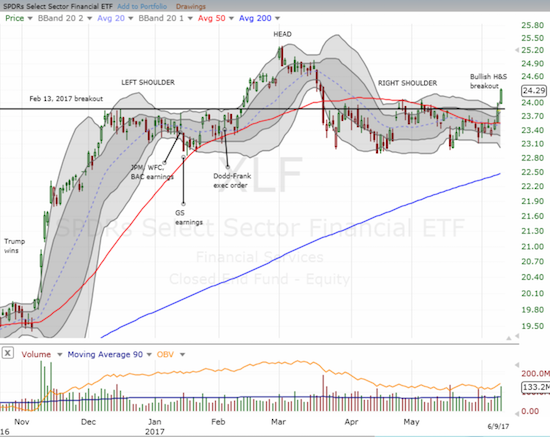
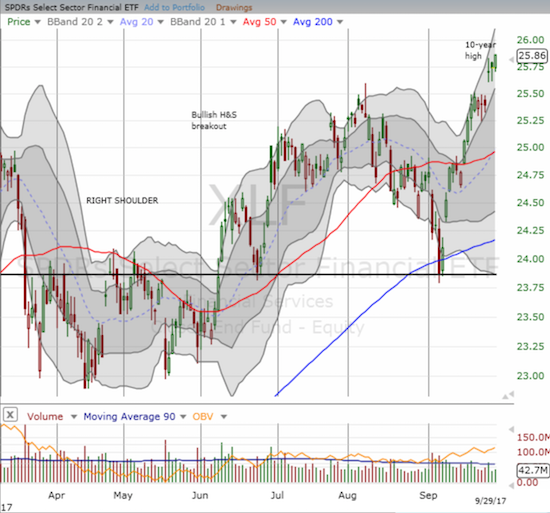
The Financial Select Sector SPDR ETF (XLF) has suddenly come back to life. XLF closed the week with a breakout that invalidated the looming head and shoulders topping pattern.
Excluding the retailers, these charts stand in stark bullish contrast to the near implosion by big cap tech stocks.
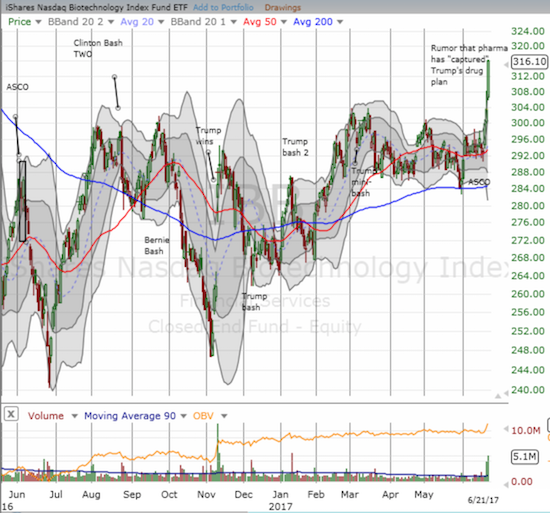
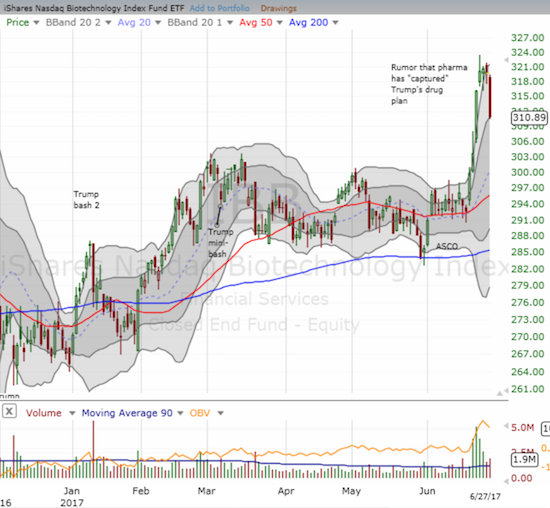
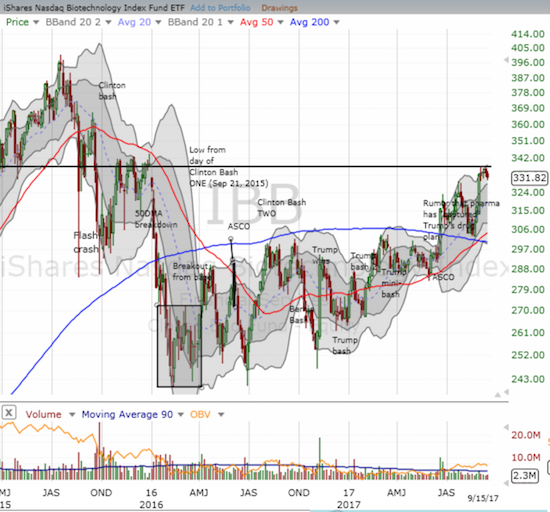
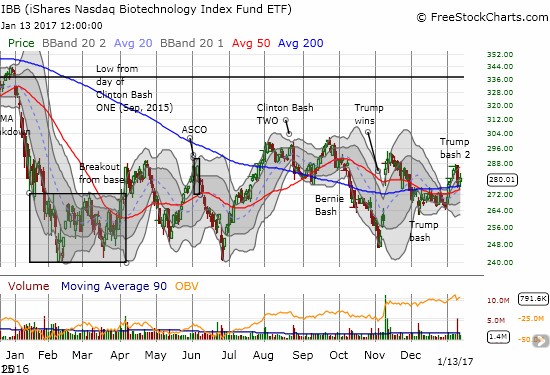
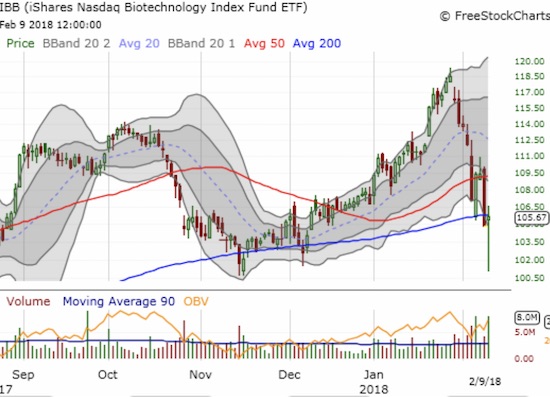
Even biotech stocks held their own at the close, albeit off a one month intraday high.
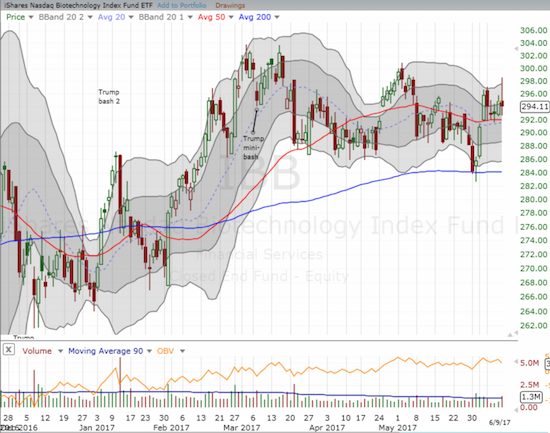
The iShares Nasdaq Biotechnology (IBB) held above 50DMA support after it faded off a one month high.
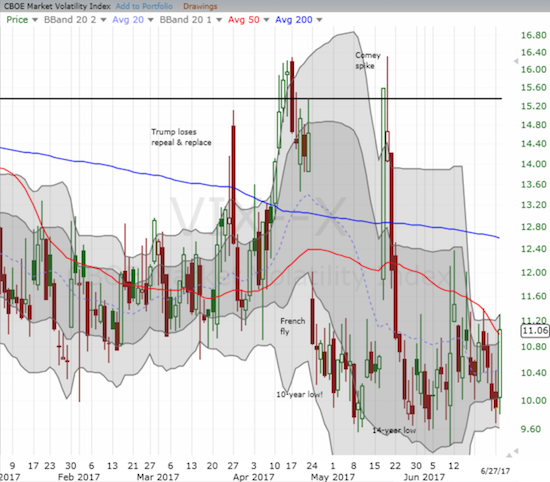
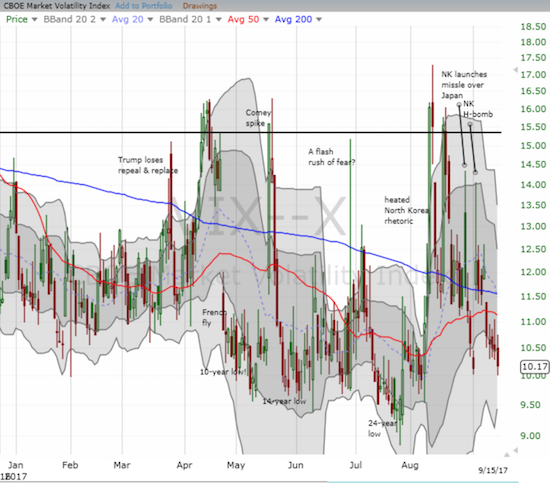
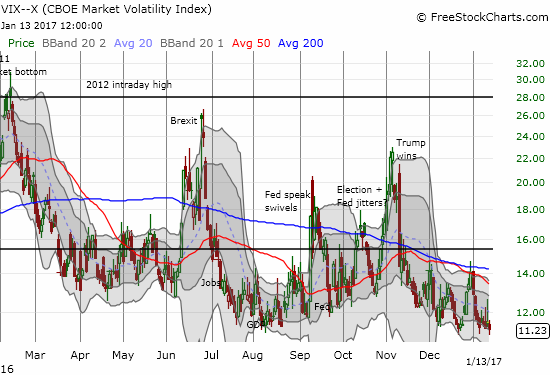
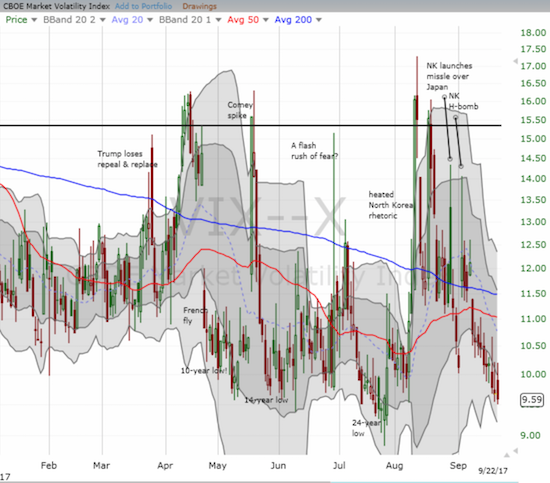
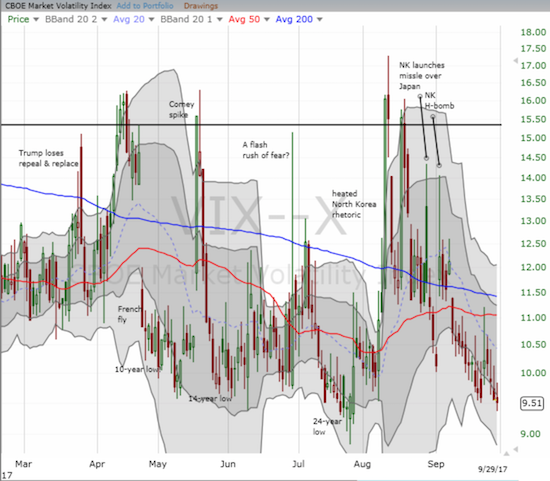
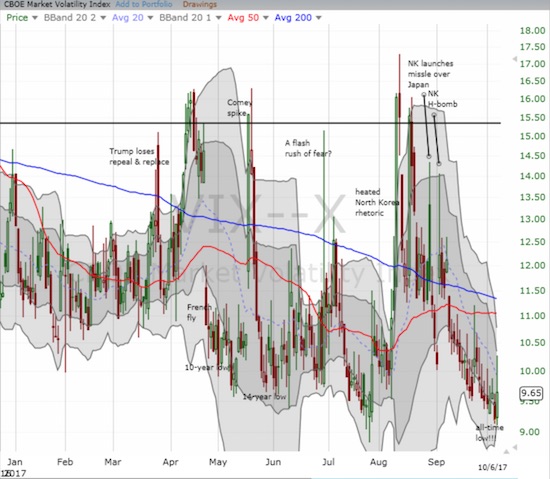
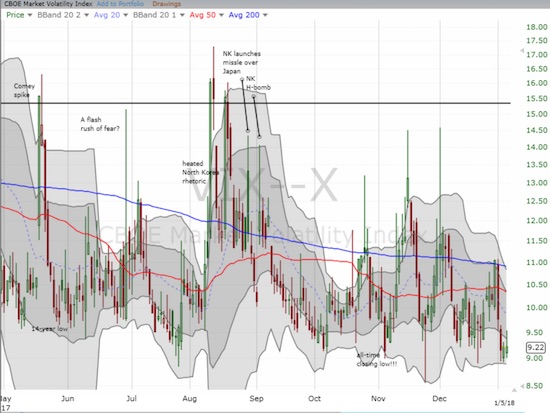
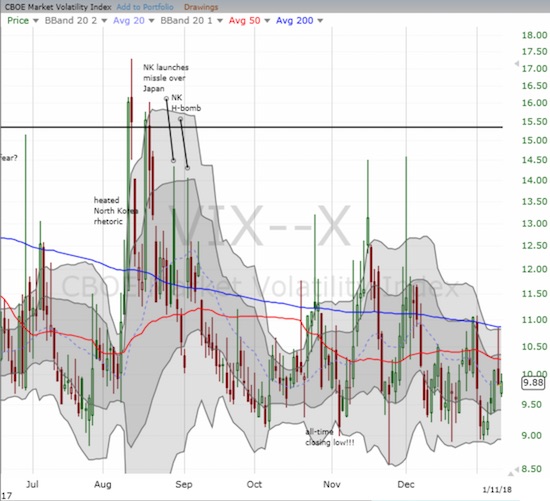
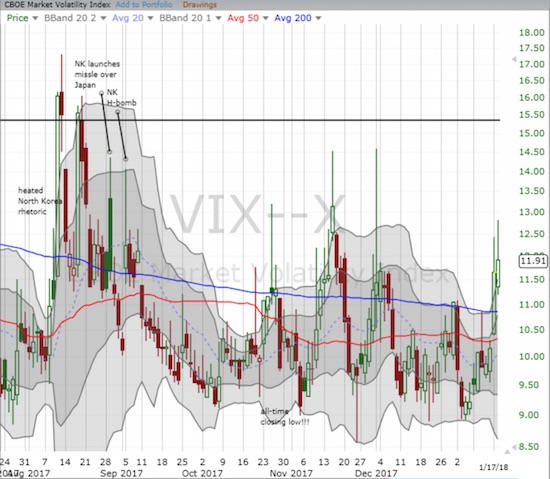
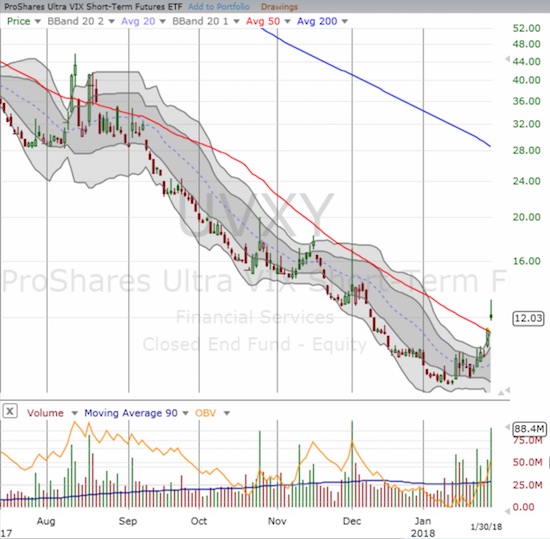
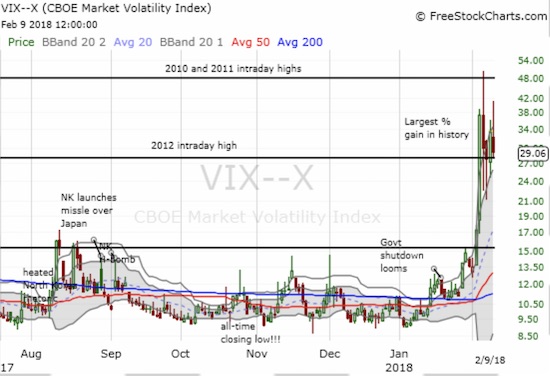
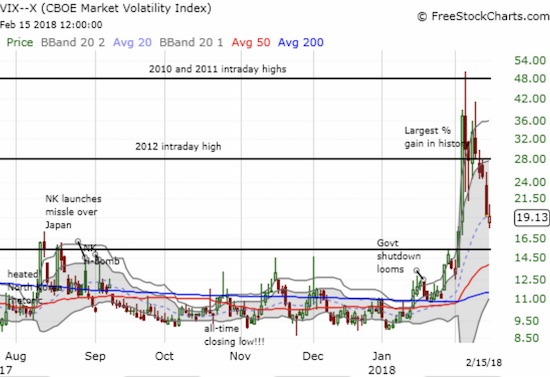
The volatility index, the VIX, provided the icing on the cake. The sudden implosion of big cap tech stocks put enough fear in the market to send the VIX soaring all the way to 12.1, a 14.2% gain. The irony of the sudden burst is that it made my fistful of call options on ProShares Ultra VIX Short-Term Futures (UVXY) quite profitable the day AFTER I thought I needed them most. Per my strategy, I sold quickly into the spike. True to form, volatility imploded almost as quickly as it exploded. After the dust settled, the VIX closed with a much smaller gain of 5.3% and UVXY closed with a very sharp fade to a paltry (and under-performing) 2.8% gain.
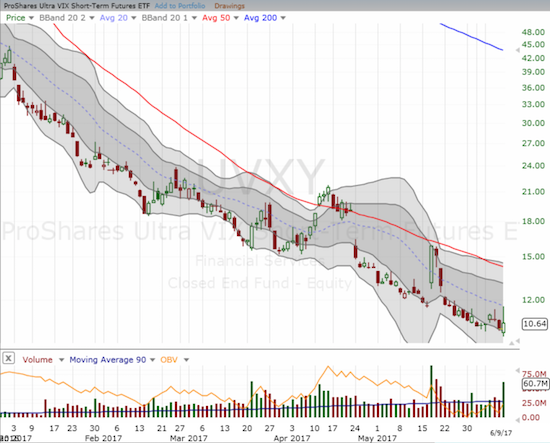
The ProShares Ultra VIX Short-Term Futures (UVXY) experienced another brief bout of glory.
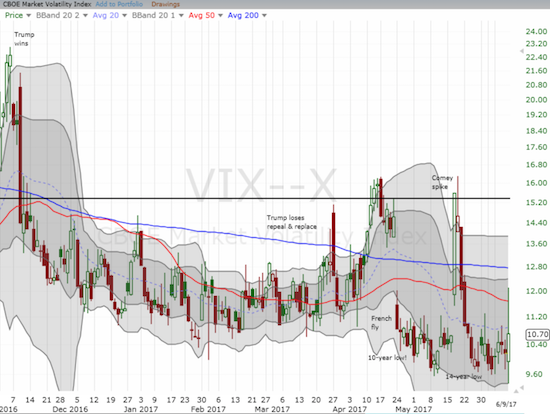
The sharp implosion of the VIX off its high confirmed the generally bullish tone of the day. The close is right back in extremely low territory (below 11).
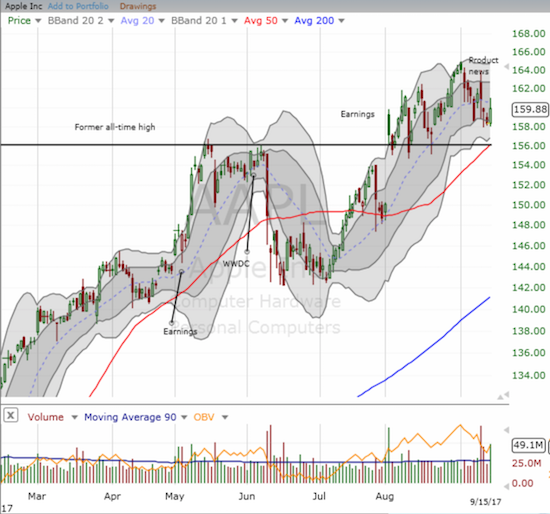
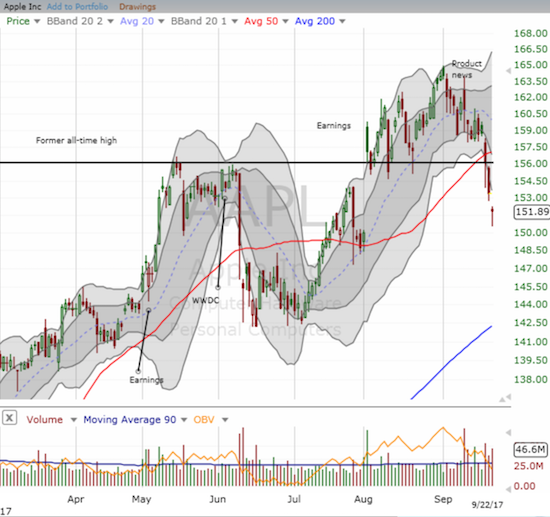
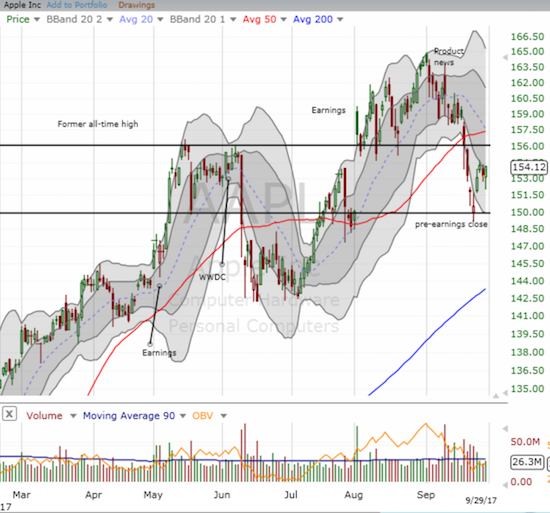
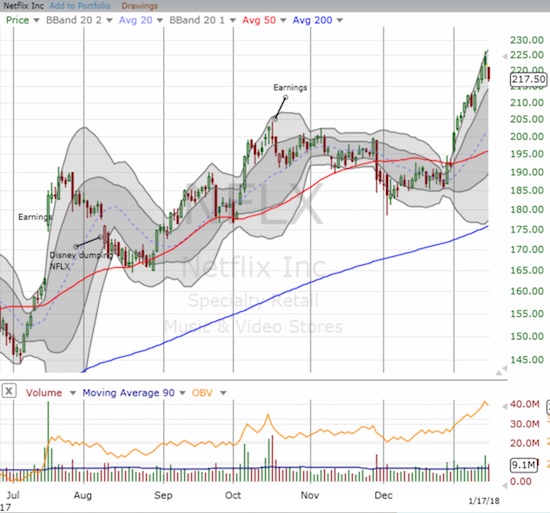
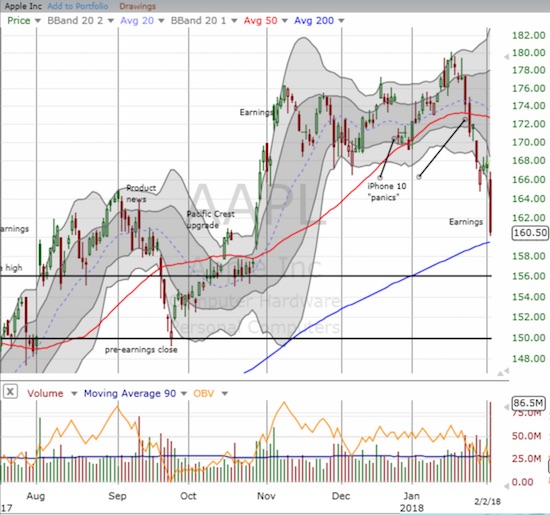
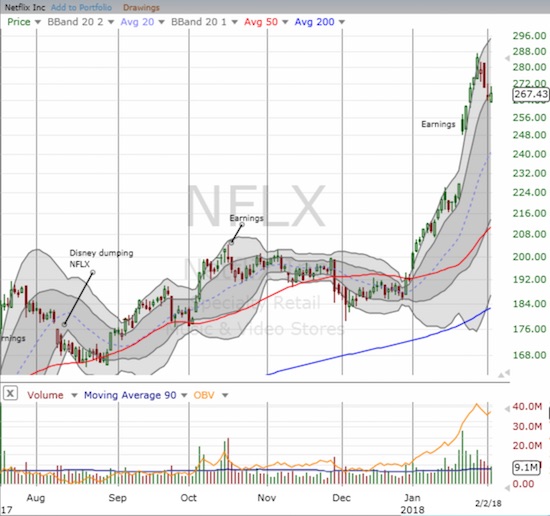
The declines in the big-cap tech stocks were truly stunning. Here is a sample with a listing of the closing loss and the loss at the low of the day: Netflix (NFLX) -4.7%/-7.0%; Alphabet (GOOG) -3.4%/-4.8%; Amazon.com (AMZN) -3.2%/-8.2%; Facebook (FB) -3.3%/-5.2%; Apple (AAPL) -3.9%/-5.8%. These losses represented some SERIOUS profit-taking that surely helped fund rallies in the rest of the stock market. AAPL had some stock specific news that exacerbated its woes. From Bloomberg:
“Verizon Corp., AT&T Inc. and the rest of the U.S. wireless industry have a big boast for this year’s crop of smartphones: thanks to network upgrades, devices will be able to download as much as a gigabit of data in a single second — speeds 100 times faster than before.
But that won’t be the case for Apple Inc.’s newest iPhones, devices to go on sale later this year, leaving the company’s most important product potentially lagging behind the data performance of rival smartphones.
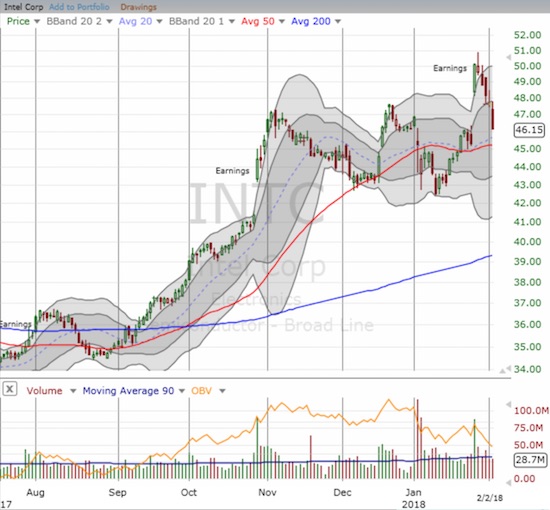
The reason stems from the delicate and sometimes complicated way Apple manages the supply of the components embedded in its flagship device — in this case, the modems, which handle the connection between a phone and the cellular network. One of Apple’s suppliers, Qualcomm Inc., sells a modem capable of the 1 gigabit download speeds. Another supplier, Intel Corp., is working on a modem with the same capability, but it won’t be ready for the iPhone’s introduction, according to people familiar with Apple’s decision.”
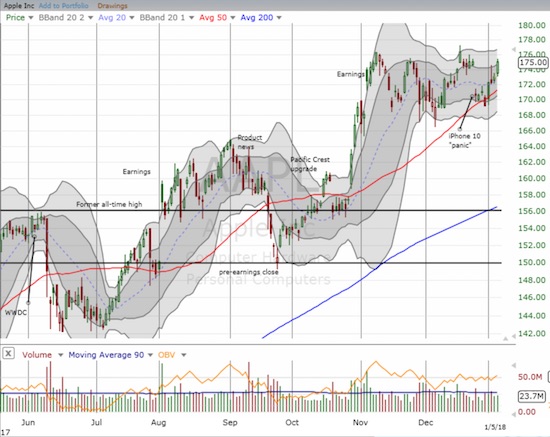
Even so, I think AAPL’s large loss on the day was largely in sympathy with its big cap cousins. I bought AAPL weekly call options on the initial weakness with what I thought at that time was a low ball offer. I doubled down as Apple doubled its loss on the day.
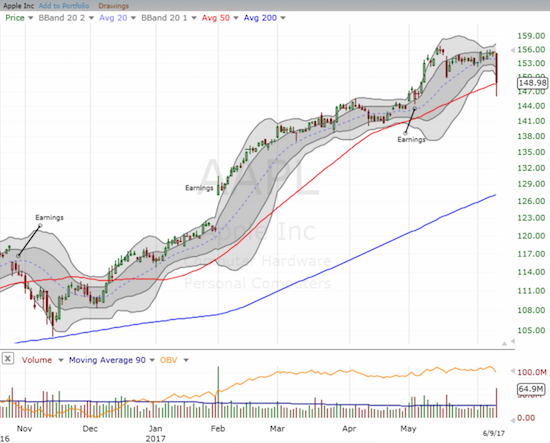
Apple (AAPL) managed to bounce off its intraday low to close right above its 50DMA – a line that has held as support since December, 2016.
As I stated in my last Above the 40 post, I was poised to get aggressively bullish on the stock market if XLF (financials) invalidated the H&S topping pattern. I did not count on a big piece of the market failing to cooperate. The plunge in tech was damaging enough to keep my short-term trading call at cautiously bullish. I think another major buying opportunity is coming for big cap tech stocks, but traders should exercise enough patience to let this apparent rotation of funds work itself out. A potential catalyst could be the Federal Reserve meeting on Wednesday June 14th. I imagine the rally in financials will peak around that time. Subsequently, traders should return their attention to tech stocks which will show signs of bottoming out from whatever selling pressure remains.
Still, it will be hard to get re-excited about tech stocks like Nvidia (NVDA) which rallied to a fresh all-time high only to plunge below the low of the previous day – a classic bearish engulfing top. At least buyers rallied NVDA off its lows and back to the start of the previous day’s gap up. I suspect from here NVDA will take time to heal. NVDA lost 6.5% on the day but was down as much as 10.7% – yep, in one day!
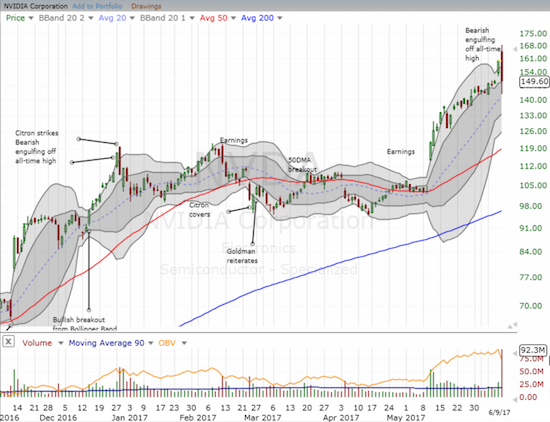
Nvidia (NVDA) printed a classic bearish engulfing top.
Let’s see whether the Golden State Warriors are ready to lead the charge for tech stocks to bounce back from a wicked day of selling. The sweep broom was broken but not the trend…

LeBron James finally has something to celebrate in the 2017 NBA Finals. Go Dubs.
Source: Yahoo Sports
Be careful out there!
— – —
FOLLOW Dr. Duru’s commentary on financial markets via email, StockTwits, Twitter, and even Instagram!
“Above the 40” uses the percentage of stocks trading above their respective 40-day moving averages (DMAs) to assess the technical health of the stock market and to identify extremes in market sentiment that are likely to reverse. Abbreviated as AT40, Above the 40 is an alternative label for “T2108” which was created by Worden. Learn more about T2108 on my T2108 Resource Page. AT200, or T2107, measures the percentage of stocks trading above their respective 200DMAs.
Active AT40 (T2108) periods: Day #326 over 20%, Day #146 over 30%, Day #13 over 40% (overperiod), Day #2 under 50% (underperiod), Day #28 under 60%, Day #98 under 70% (corrected from June 2, 2017 post)
Daily AT40 (T2108)
")
Black line: AT40 (T2108) (% measured on the right)
Red line: Overbought threshold (70%); Blue line: Oversold threshold (20%)
Weekly AT40 (T2108)

*All charts created using freestockcharts.com unless otherwise stated
The charts above are my LATEST updates independent of the date of this given AT40 post. For my latest AT40 post click here.
Related links:
The T2108 Resource Page
You can follow real-time T2108 commentary on twitter using the #T2108 or #AT40 hashtags. T2108-related trades and other trades are occasionally posted on twitter using the #120trade hashtag.
Be careful out there!
Full disclosure: long AAPL call options, long NVDA call and put spread and shares
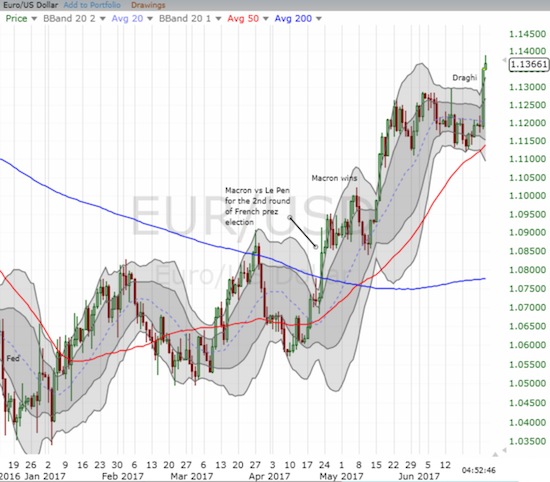
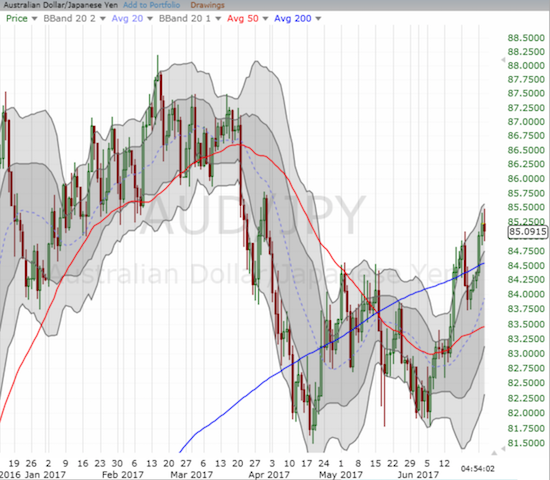
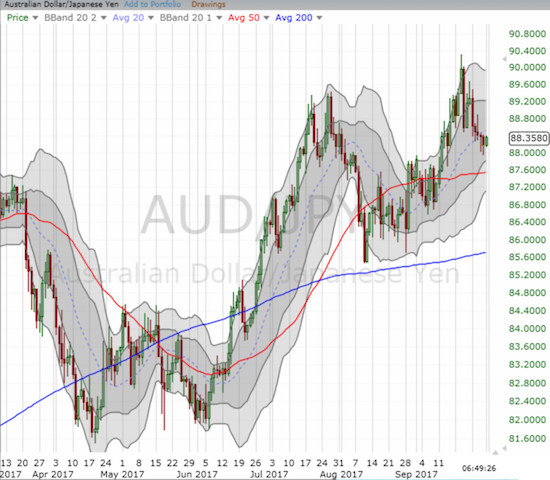
*Charting notes: FreeStockCharts.com uses midnight U.S. Eastern time as the close for currencies.