AT40 = 65.3% of stocks are trading above their respective 40-day moving averages (DMAs)
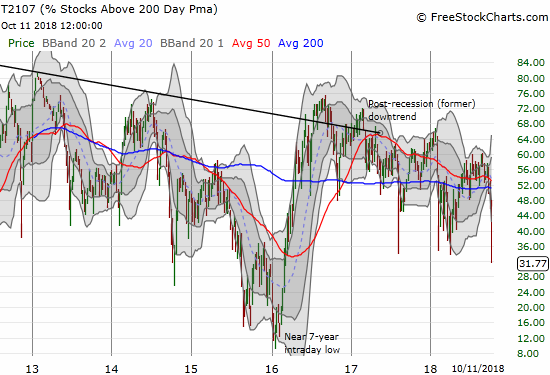
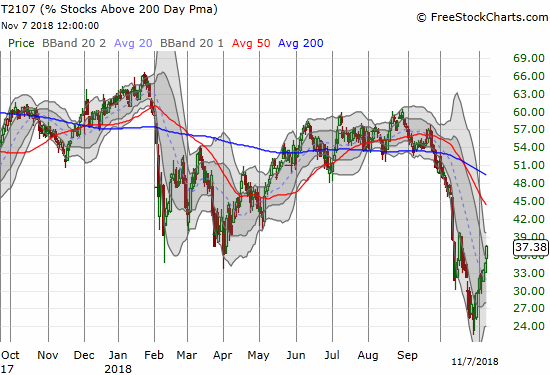
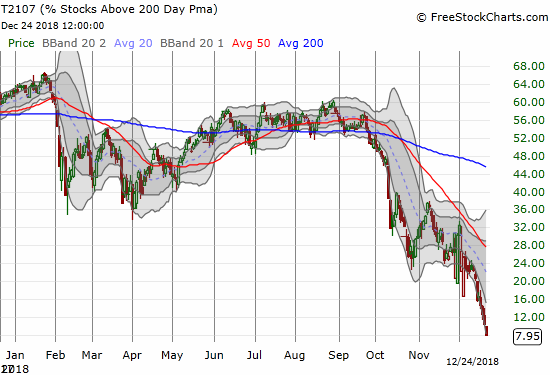
AT200 = 51.5% of stocks are trading above their respective 200DMAs
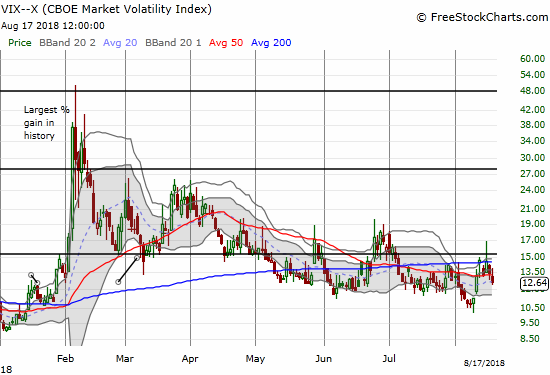
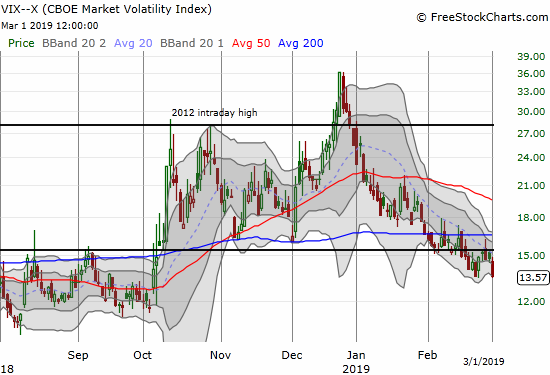
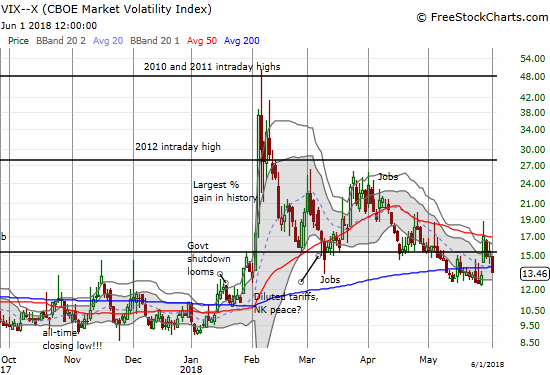
VIX = 12.7
Short-term Trading Call: neutral
Commentary
Here we are again. The stock market looks like it is breaking free, but there are major caveats which keep me wary and sitting on a neutral short-term trading call.
First the positive developments.
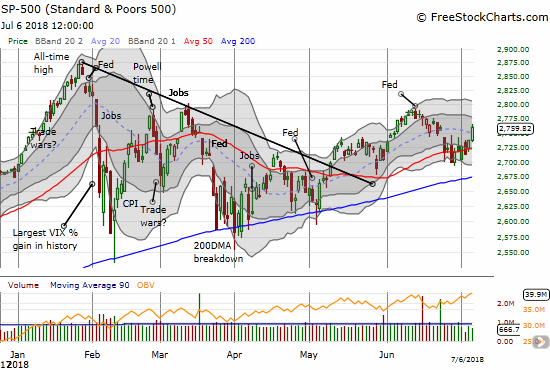
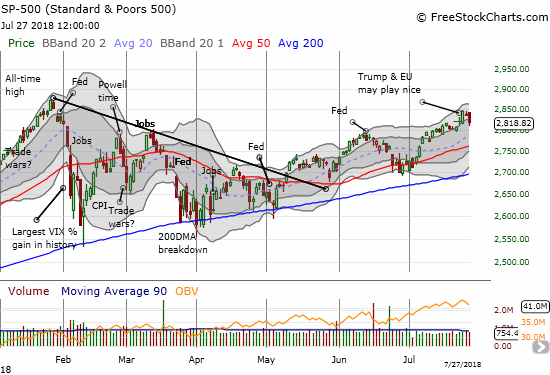
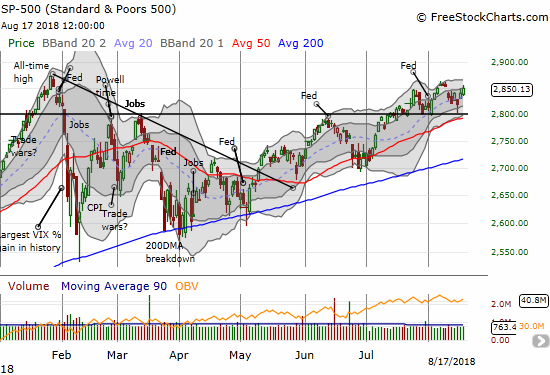
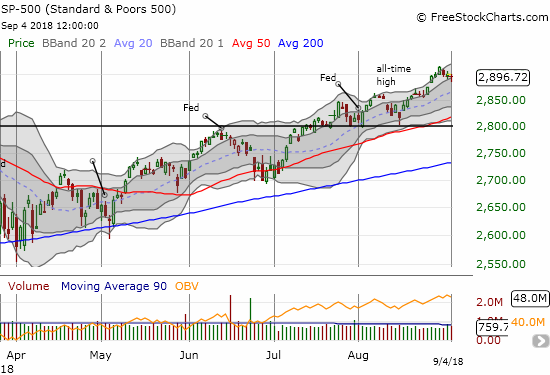
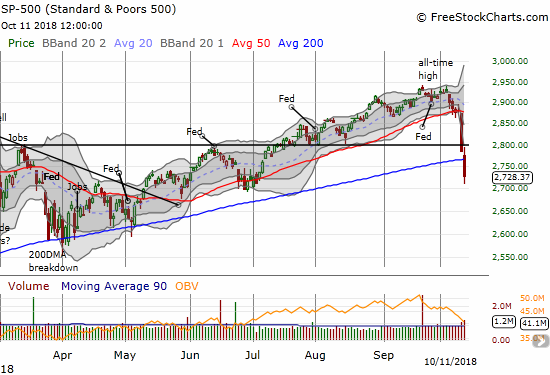
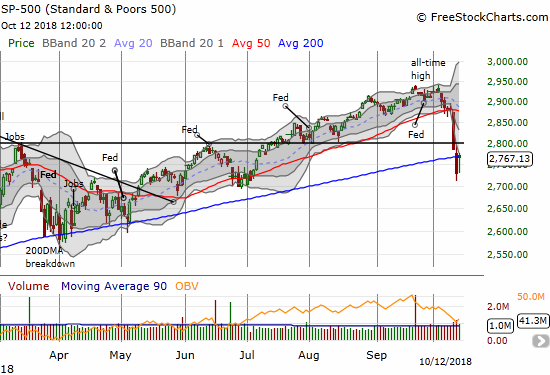
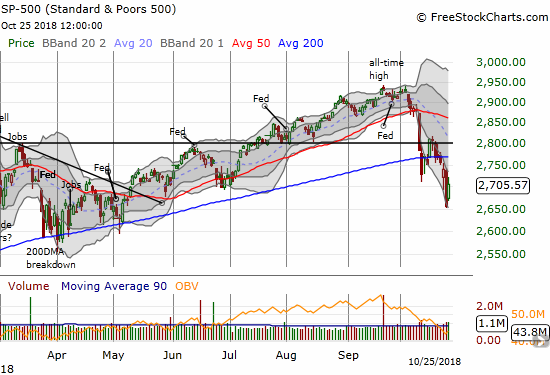
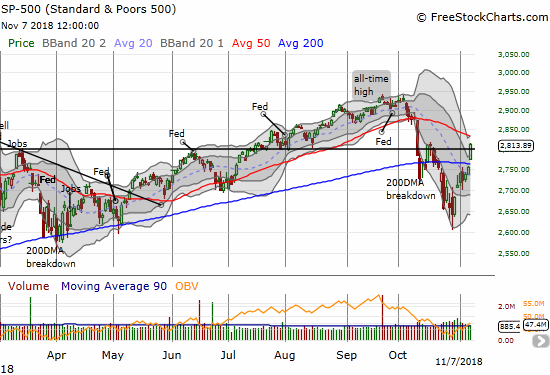
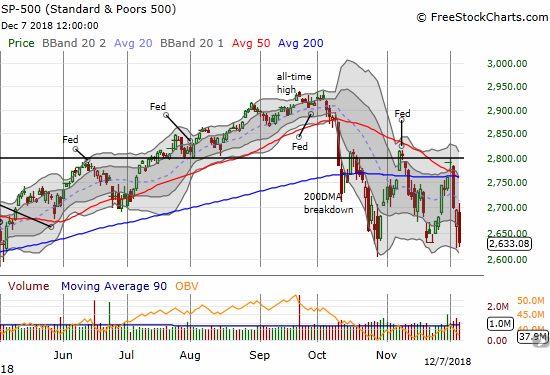
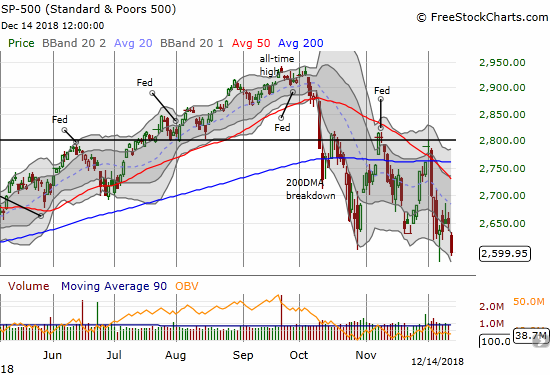
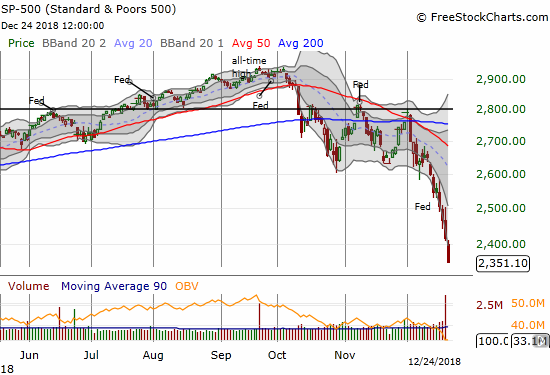
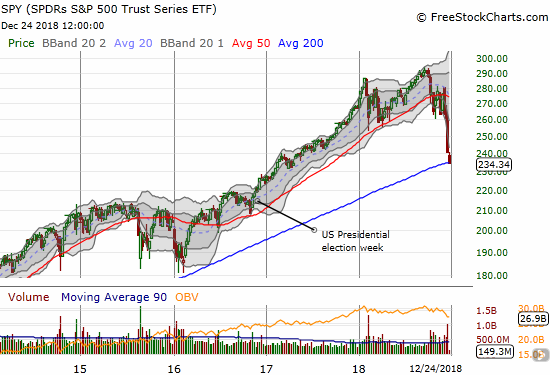
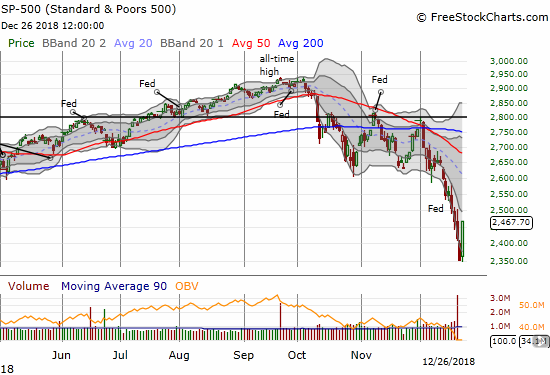
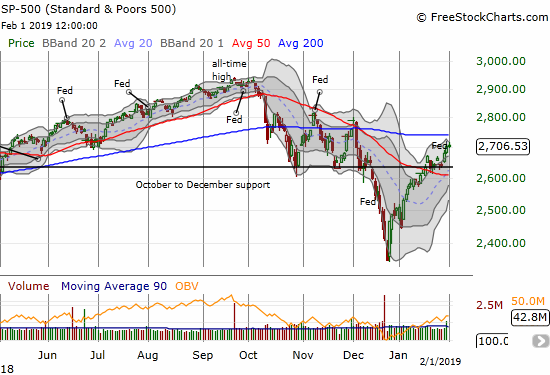
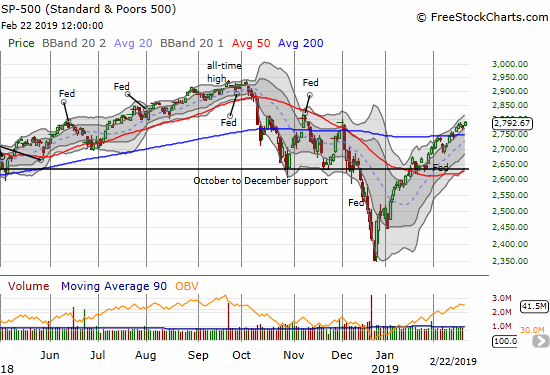
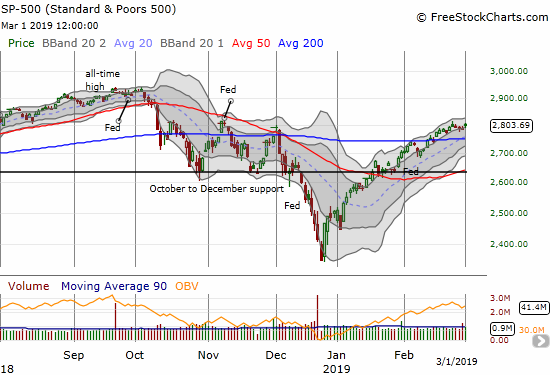
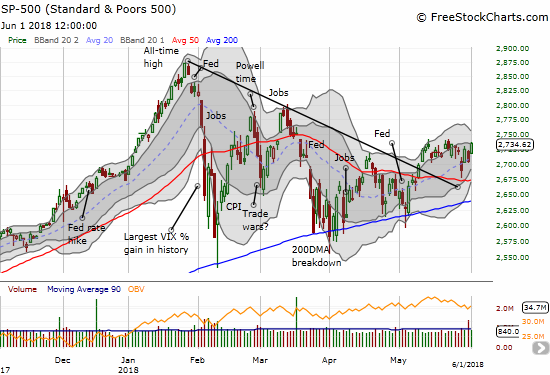
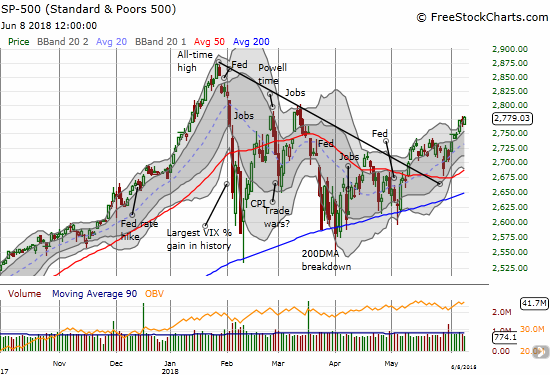
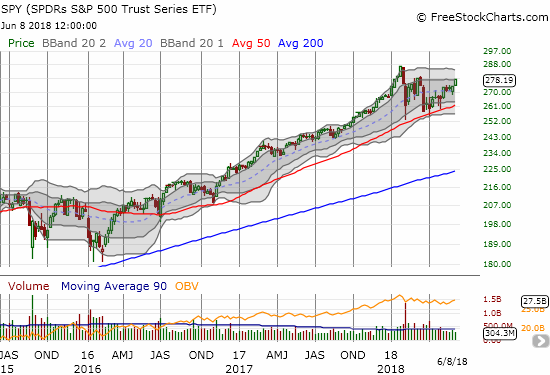
The S&P 500 (SPY) managed to follow-through on its breakout above its 50-day moving average (DMA). Sure the index gained a tiny 0.2%, but it is good enough for now.
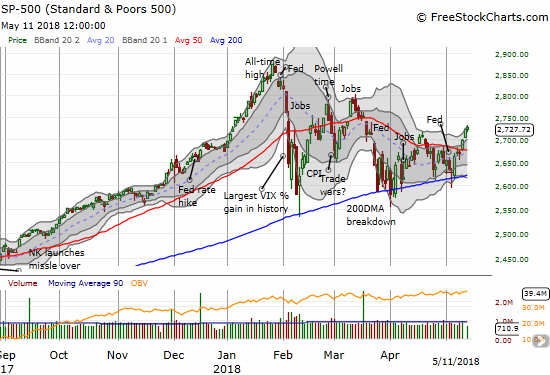
The S&P 500 followed through on its 50DMA breakout. Depending on the perspective, the triangle that has defined trading for three months also seems to be giving way to the upside.
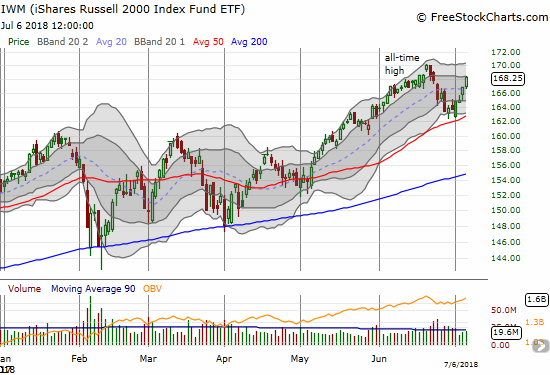
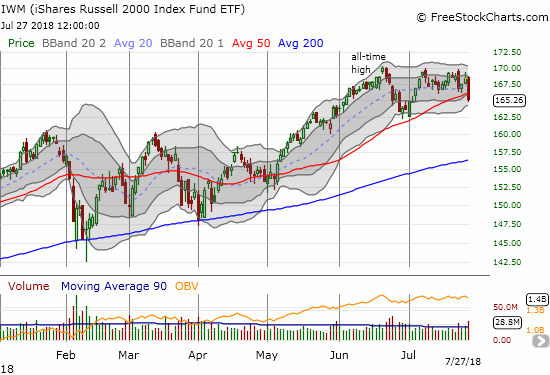
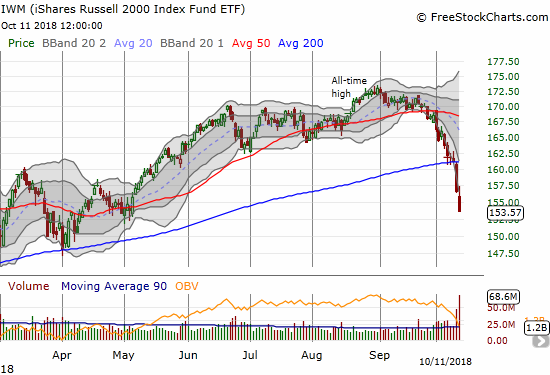
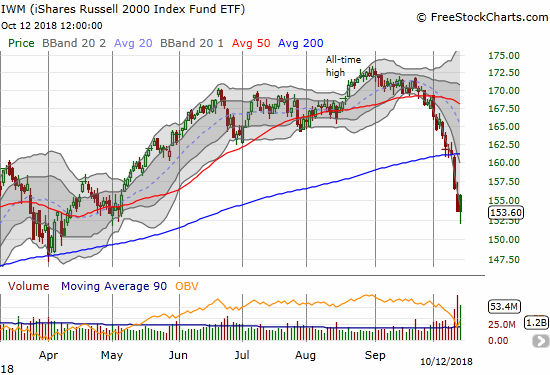
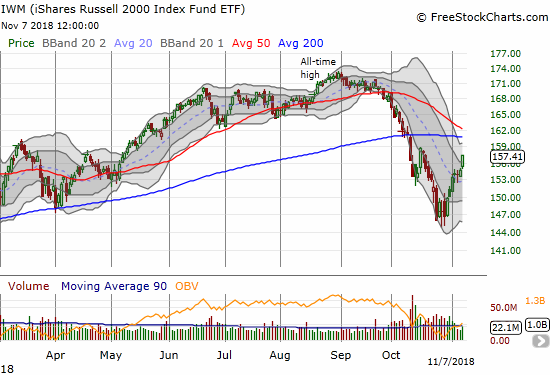
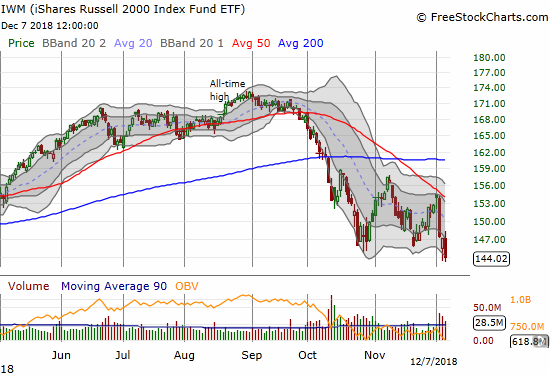
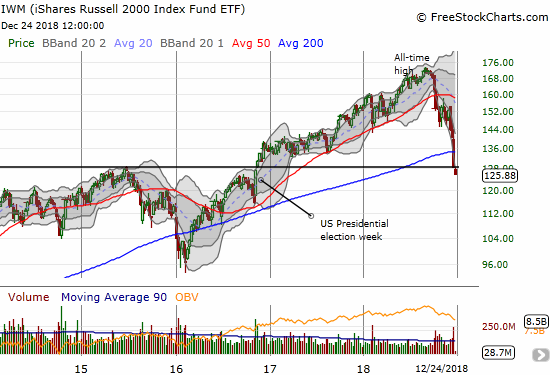
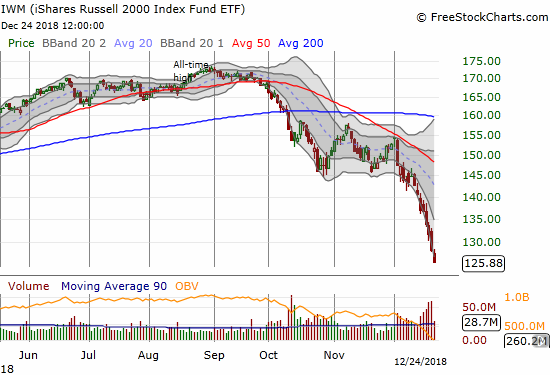
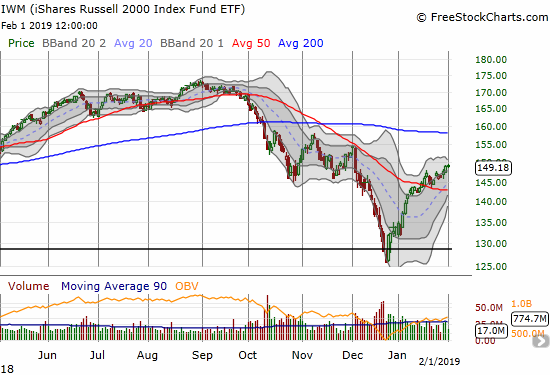
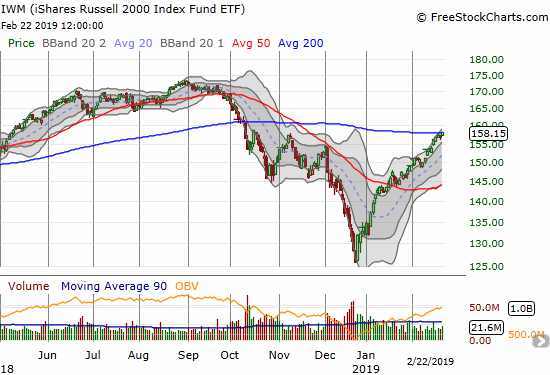
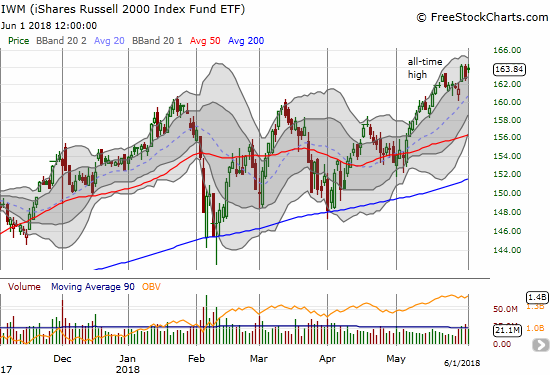
The iShares Russell 2000 ETF (IWM) is just $0.12 from its all-time high. The small cap index has been able to keep pushing along its upper-Bollinger Band (BB). The index is firmly running with the bulls, but it also cannot afford to turn back here and create what will look like a triple top.
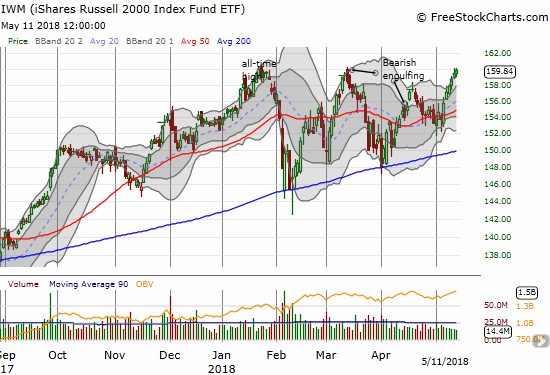
The iShares Russell 2000 ETF (IWM) is running with the bulls.
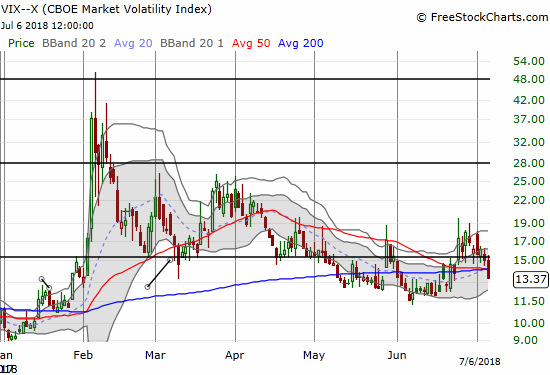
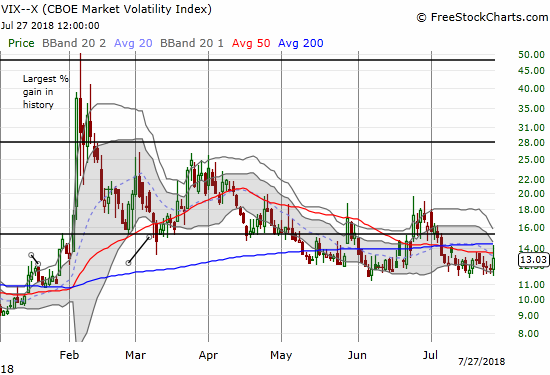
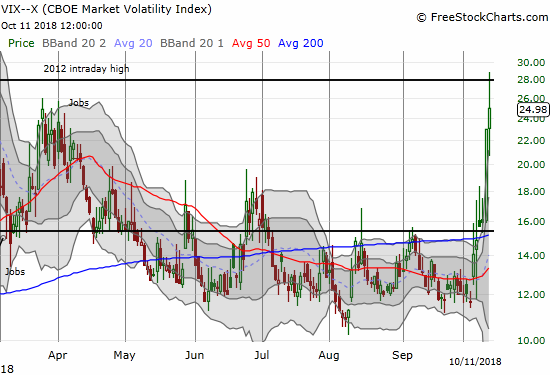
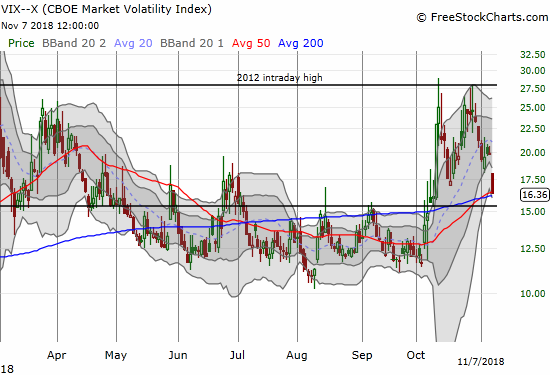
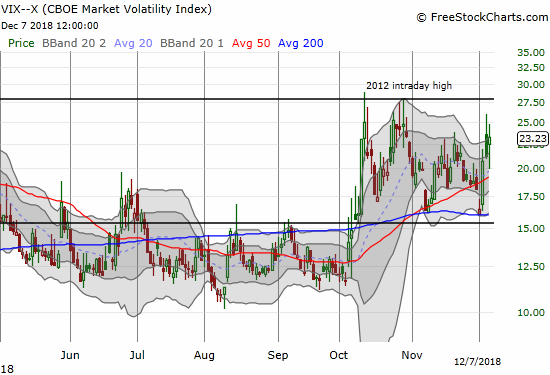
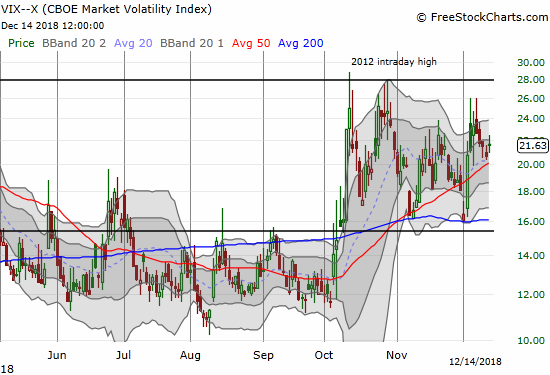
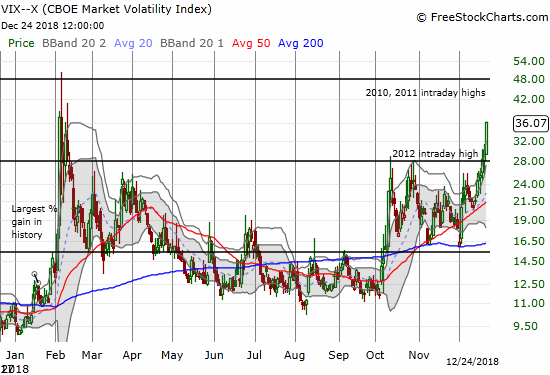
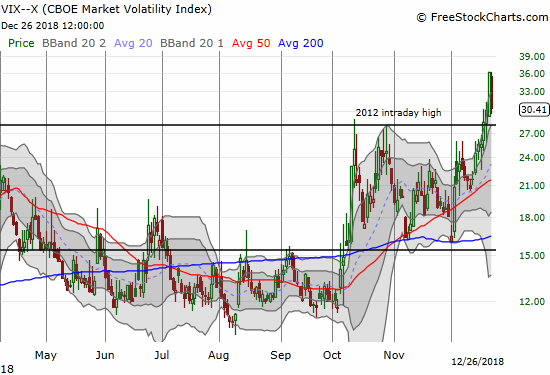
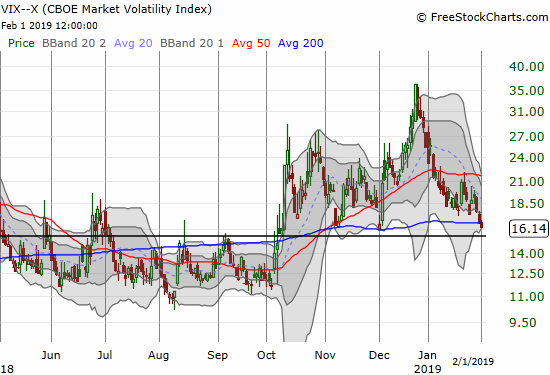
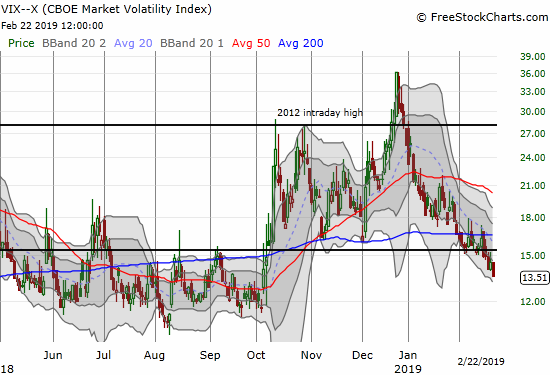
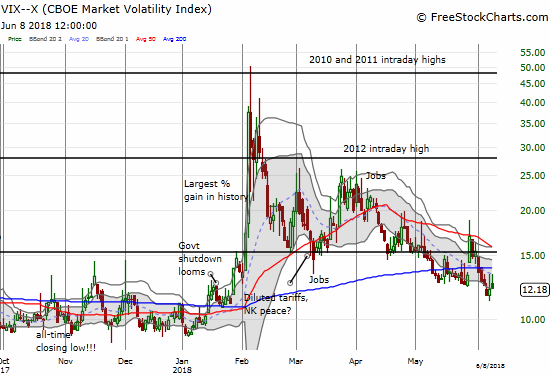
The volatility index, the VIX, fell yet again. The VIX has fallen 6 straight days and 10 of the last 12. The VIX closed below the start of the massive 2-day surge in February. The fear gauge is also just a hop, skip, and a jump away from “extremely low” territory (at or below 11)…which would be very bullish.
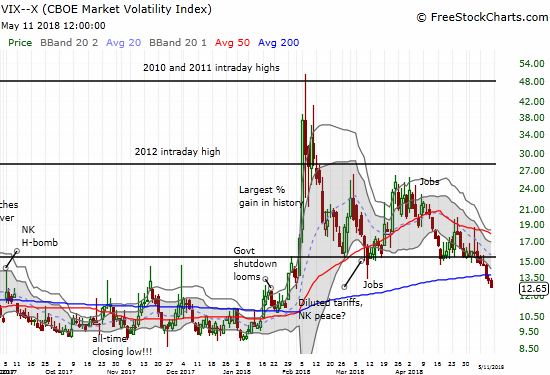
The volatility index, the VIX, is breaking away from the 15.35 pivot and plunging back to extremely low levels.
There are a few important caveats that keep me sitting on my neutral short-term trading call.
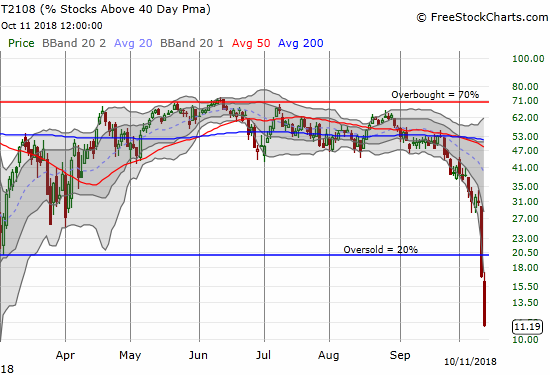
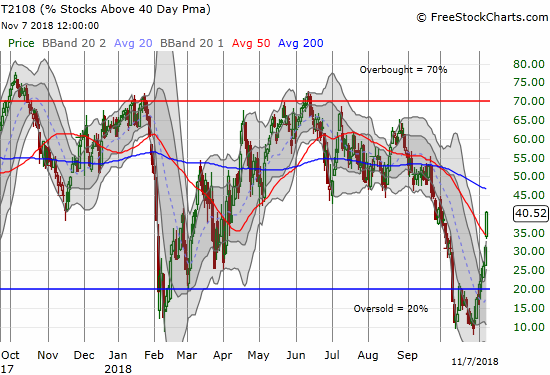
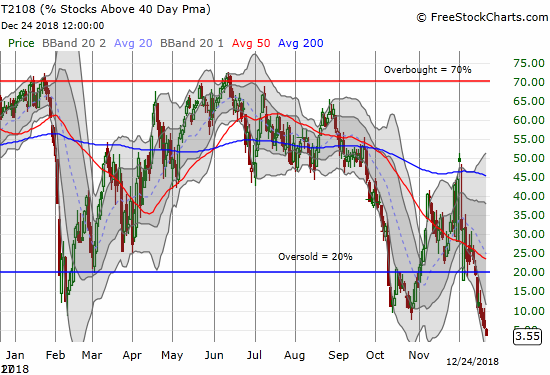
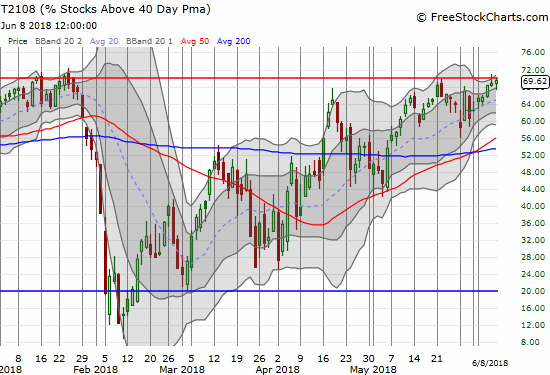
AT40 (T2108), the percentage of stocks trading above their respective 40DMAs, closed at 65.3%. My favorite technical indicator is just 5 percentage points away from the overbought threshold. The last two trips here have preceded a massive sell-off and a pullback. Can the third time be a charm? I want to wait and see.
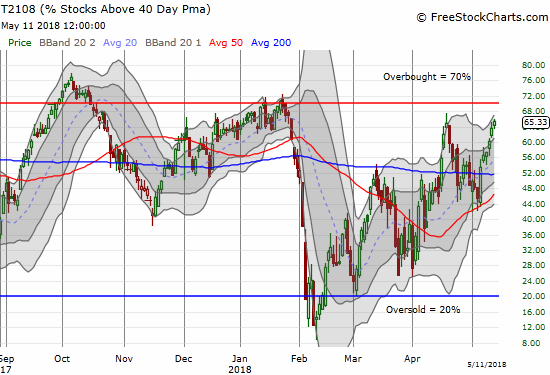
AT40 (T2108) is sneaking up on overbought territory again.
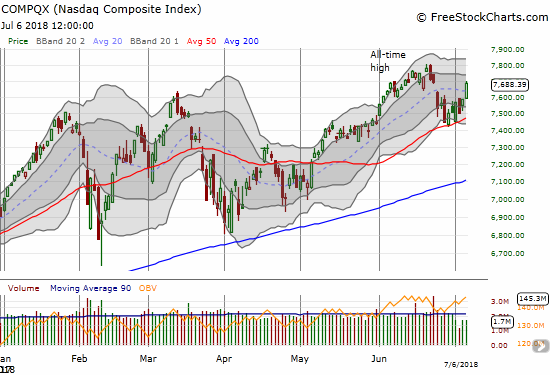
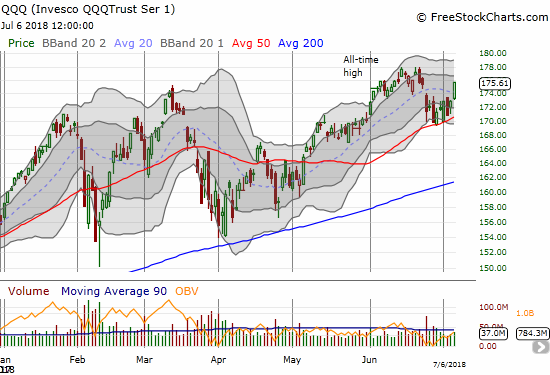
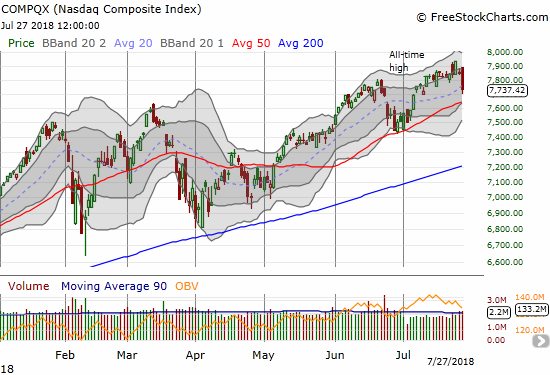
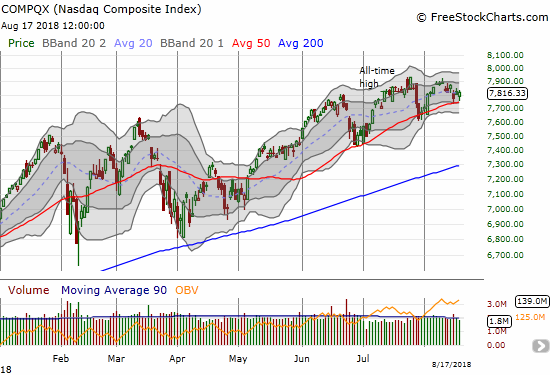
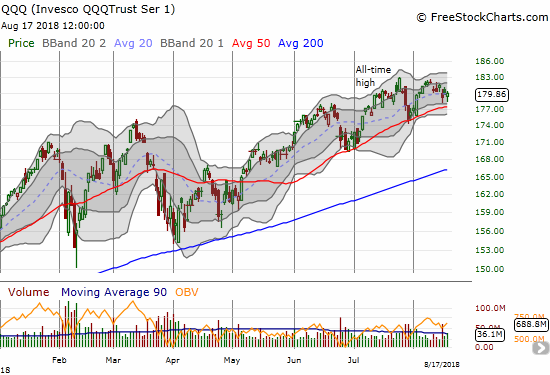
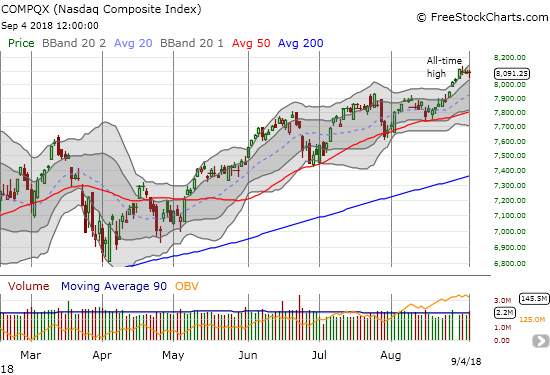
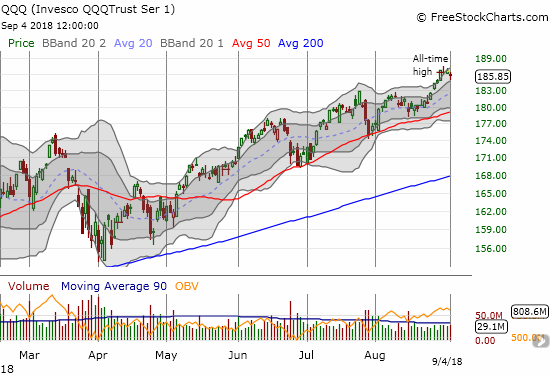
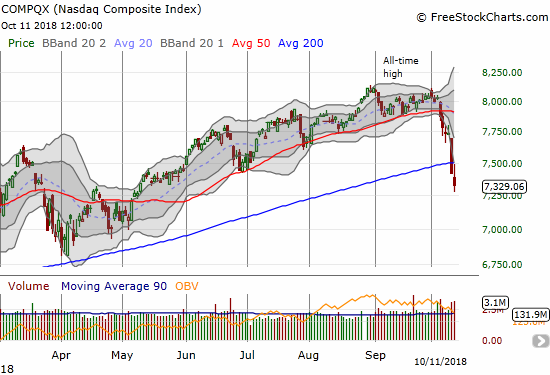
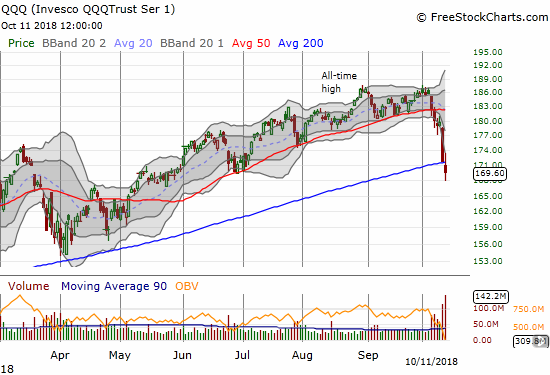
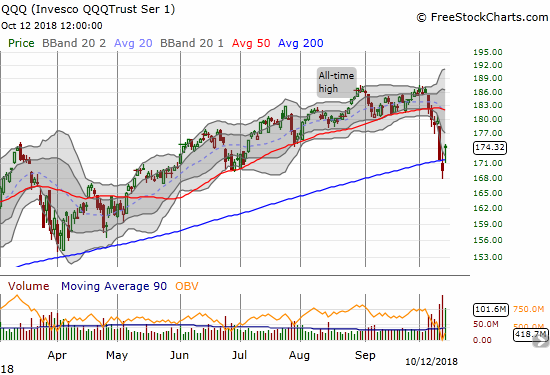
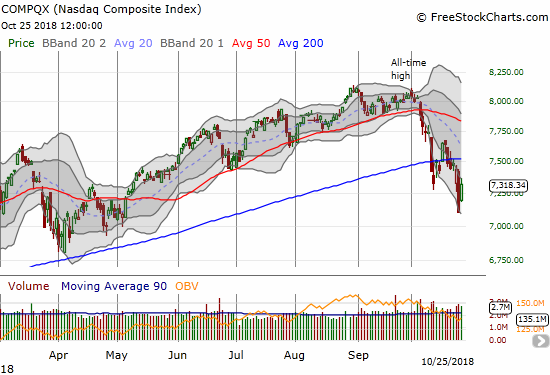
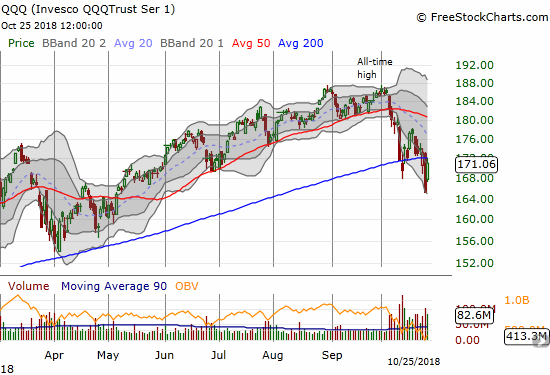
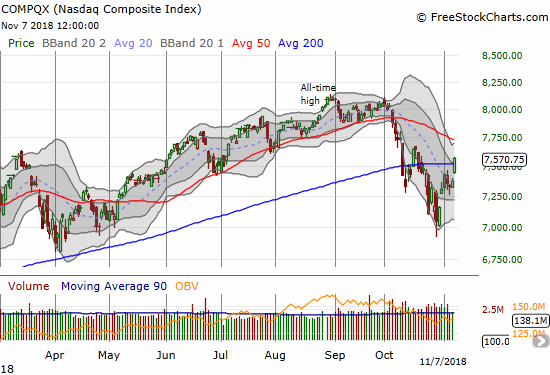
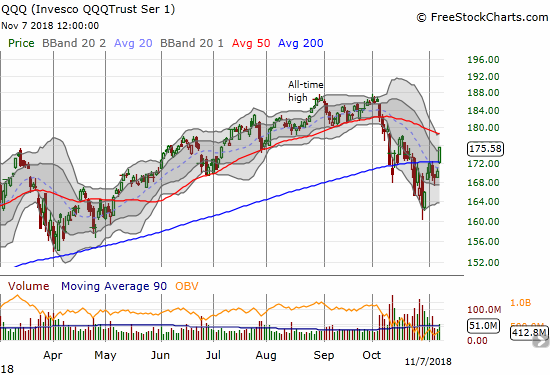
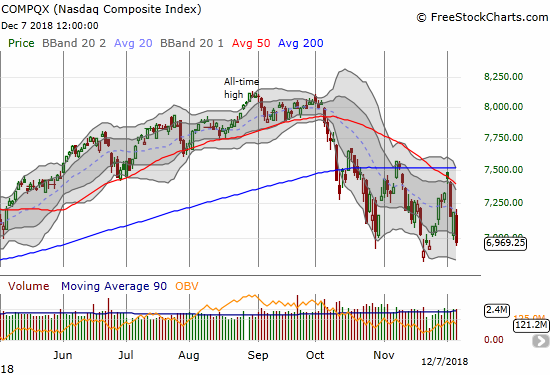
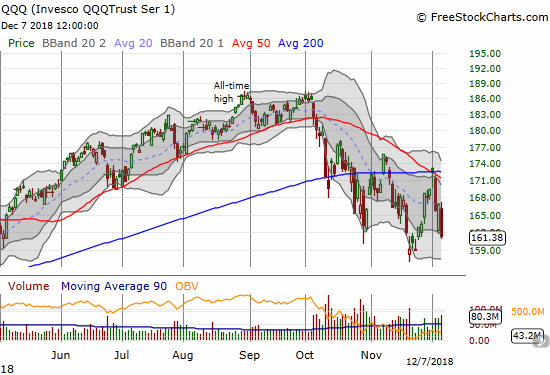
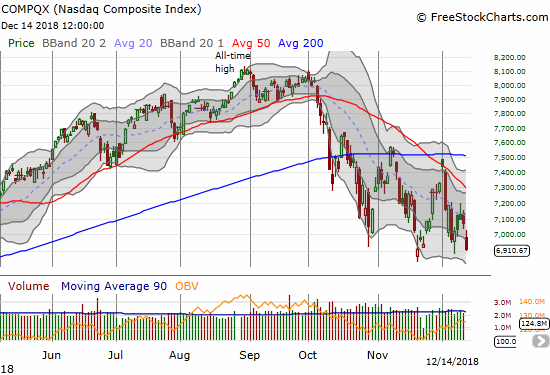
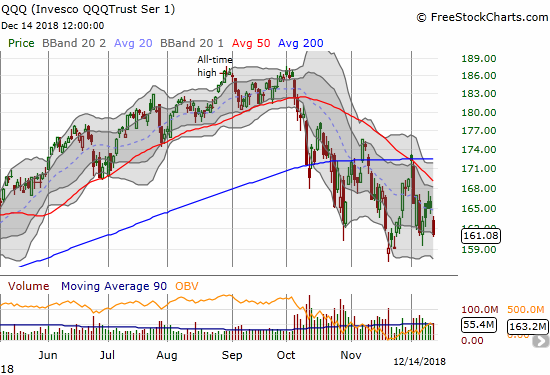
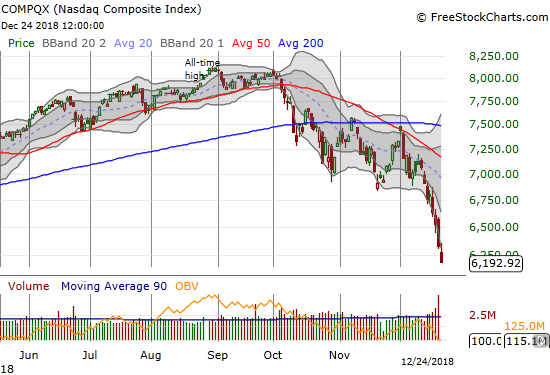
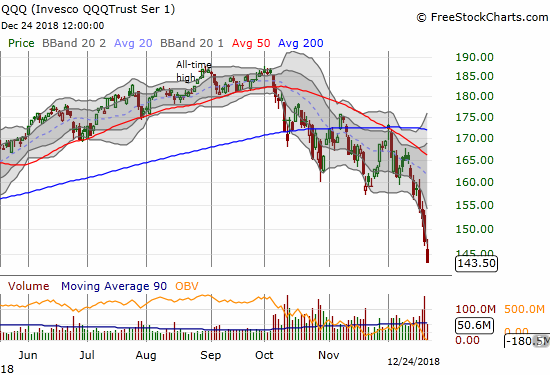
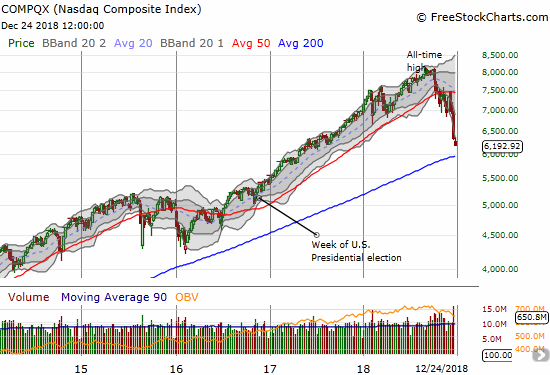
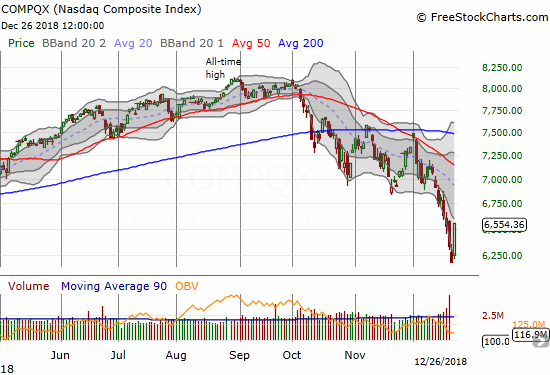
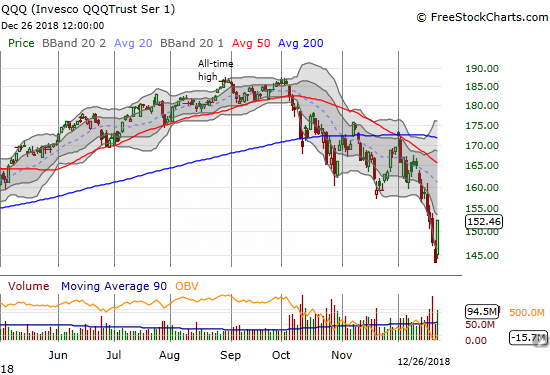
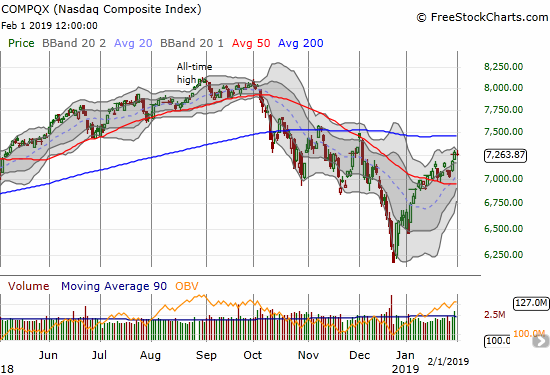
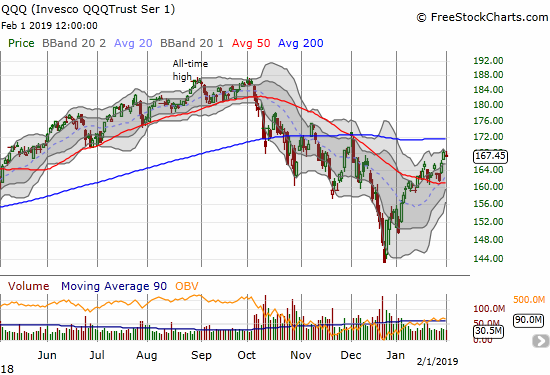
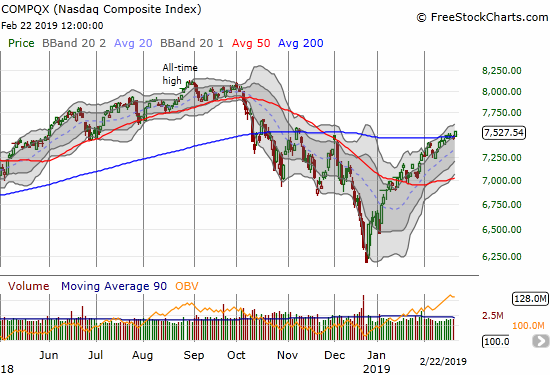
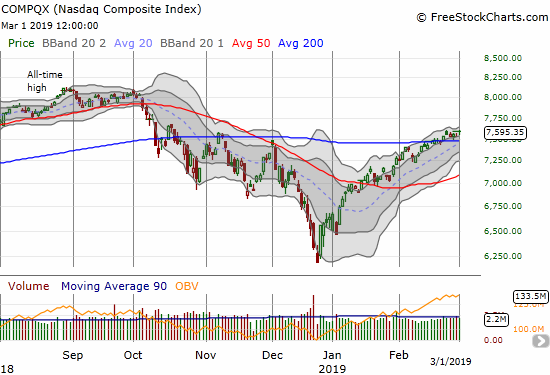
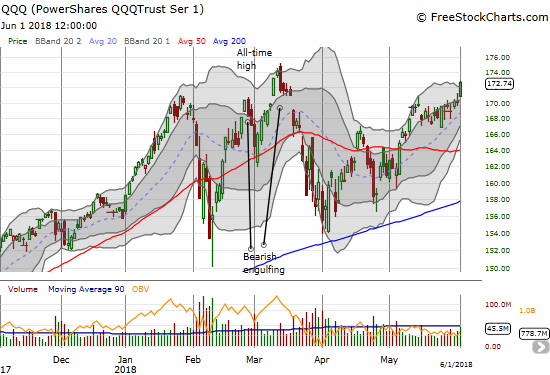
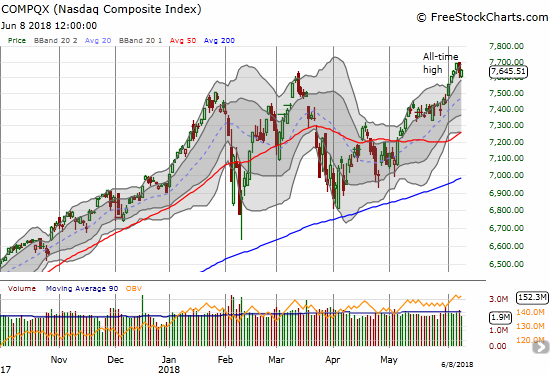
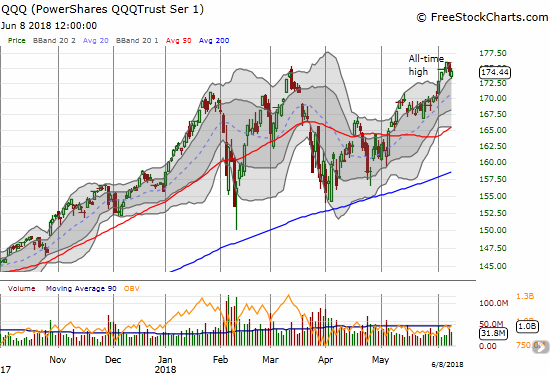
The tech-laden indices lost some steam right at a critical point. In March, tech stocks completed a resounding comeback from the February sell-off only to pull right back to the February lows. The NASDAQ and the PowerShares QQQ ETF (QQQ) gapped down from those highs to form a type of abandoned baby top, a very bearish chart formation. Both indices ended last week right at the bottom of the gap down. Buyers and bulls will really need to keep pushing through this gap to confirm bullish momentum. Since the market is rarely straightforward, I fully expect tech stocks to return to churn right here with lots of headfakes for bulls and bears alike.
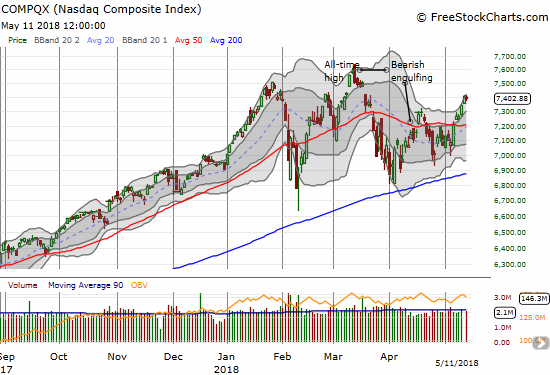
The NASDAQ ended the day flat as it faces down the bearish gap down from all-time highs in March.
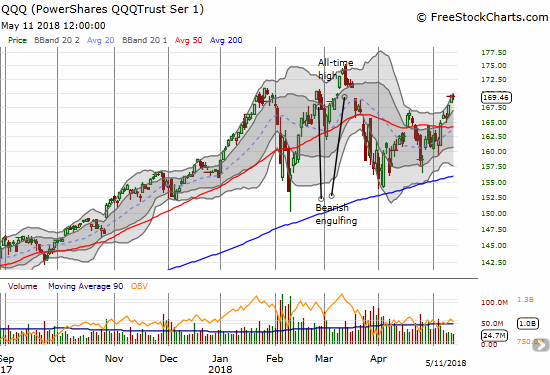
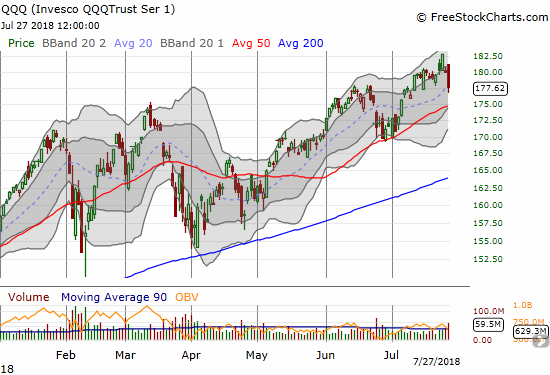
The PowerShares QQQ ETF (QQQ) also ended the day flat as it faces down the bearish gap down from all-time highs in March.
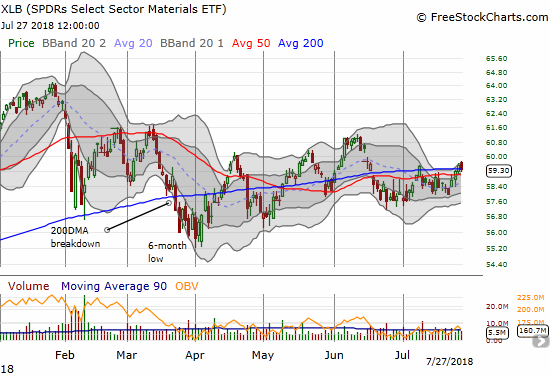
The Industrial Select Sector SPDR ETF (XLI) broke out above its 50DMA, but its fade from the day’s high makes the move look very timid and tepid. More importantly, the fade happened right at the downtrend line roughly in place since the January high. XLI has printed a consistent sequence of lower highs…this move could mark the next lower high. The industrials could weigh heavily on the general market even if big cap tech stocks continue powering forward.
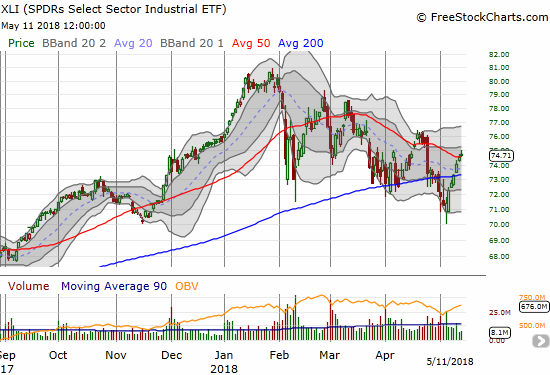
The Industrial Select Sector SPDR ETF (XLI) rallied sharply off the latest low but volume has been anemic and even declined on the move. The fade from the intraday high weakened the case for the 50DMA breakout which is an attempt to break the pattern of lower highs.
Across the board, I am wary about generally weak volume patterns. Chart after chart I am seeing lower than average volume and in many cases declining volume over the course of this latest rally. I recognize that low volume has yet to stop the bull market from rallying, but a bounce from lows or critical support on anemic and even falling volume is just plain suspicious. Sure the sellers can continue to sit on their hands as prices float higher. The caution is to prepare for their return; the resulting downdraft will likely be steep and swift. With the VIX plunging, protection is cheap: the risk/return for staying on top of put options as protection for shorter-term traders looks as good, maybe better, than the placid waters flowing into the February sell-off.
CHART REVIEWS
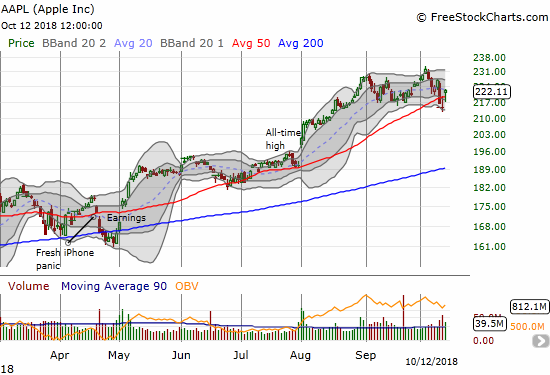
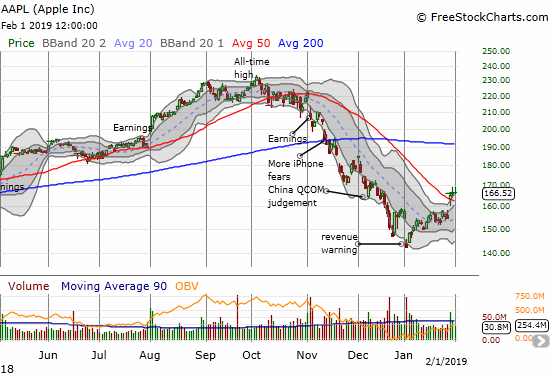
Apple (AAPL)
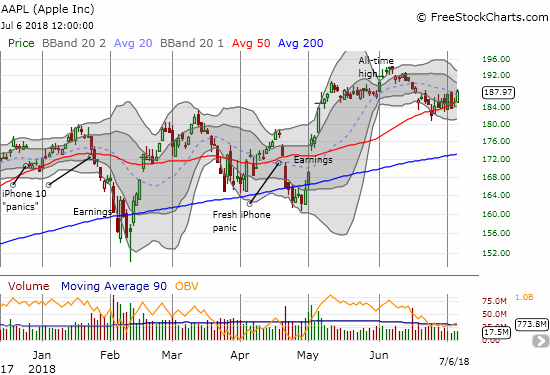
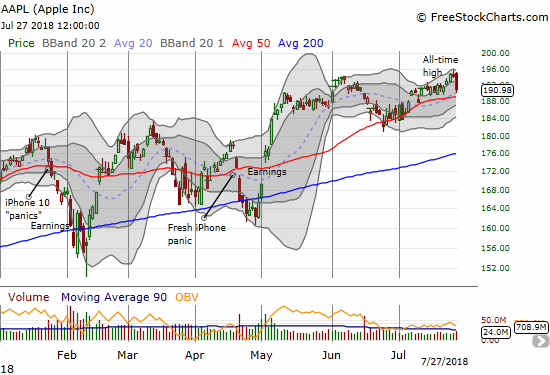
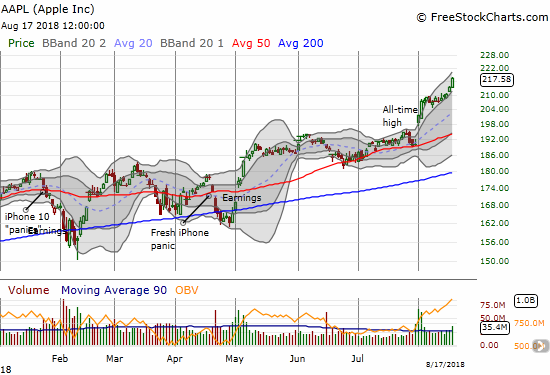
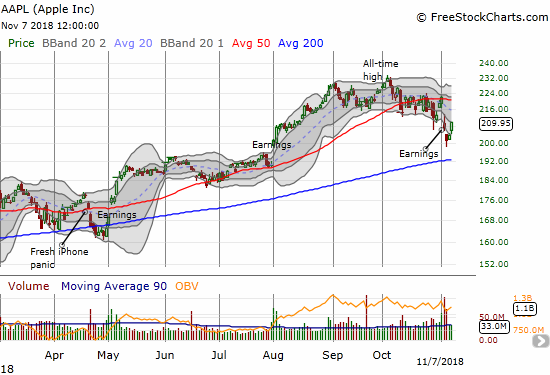
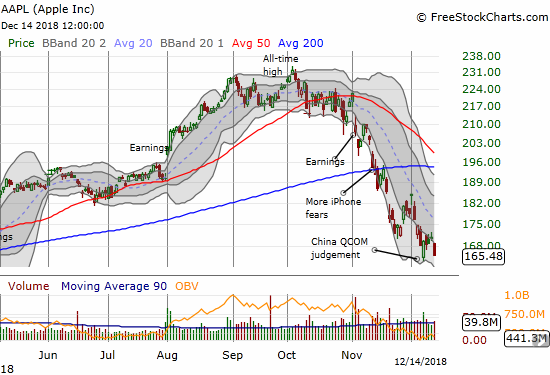
Apple continued its sentiment-leading performance this week. I also learned a hard lesson with the stock going ex-dividend on Friday. I failed to close out a long call spread and got assigned shares from the short-side of the position. Much to my dismay I discovered that assignment put me on the hook to pay the dividend. Even worse is the fact that I did not recognize the ex-dividend as a fresh catalyst to drive the stock higher. I should have been a LOT more aggressively bullish on AAPL during the week. Monday’s close will be important to determining the likelihood of continuing the momentum in the coming days, maybe weeks. Note in the chart below, the upper-Bollinger Band suggests AAPL has plenty of room left for short-term upside.
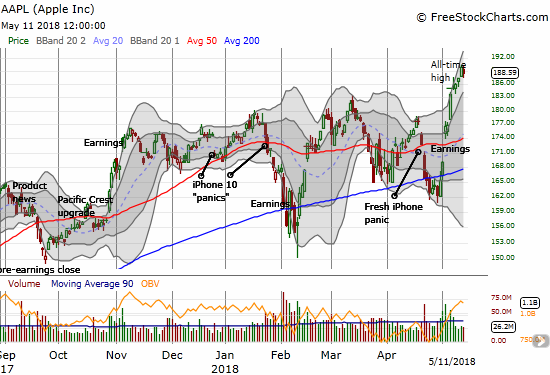
Apple (AAPL) is riding the tailwinds like a champ. I am still eyeing the shrinking volume with a wary eye as soaring volume on a new all-time high is a more solid seal of approval.
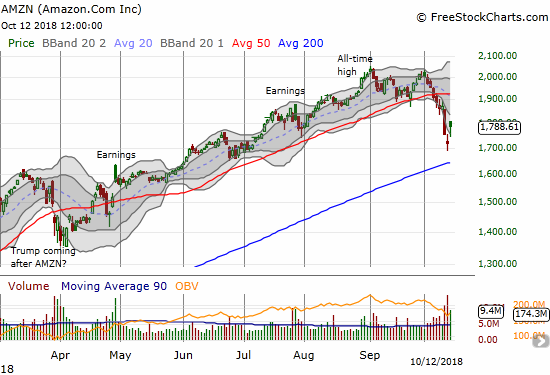
AMZN (AMZN)
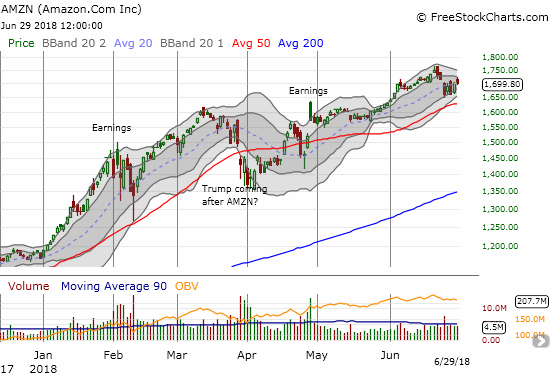
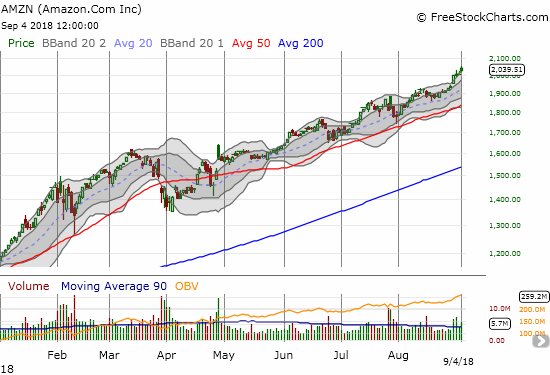
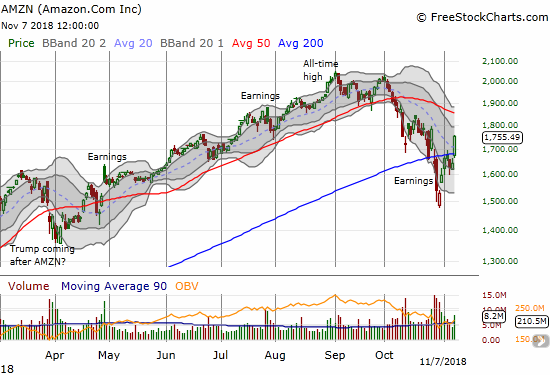
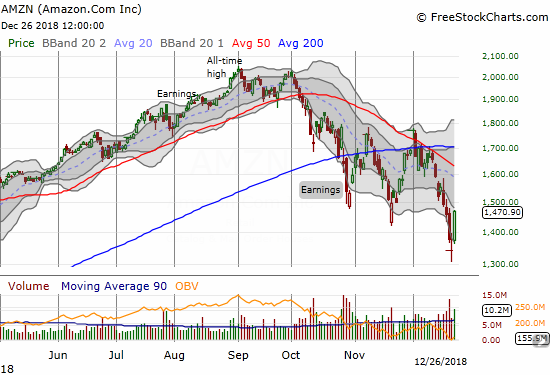
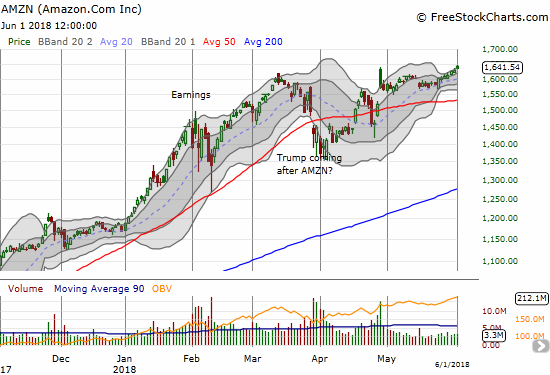
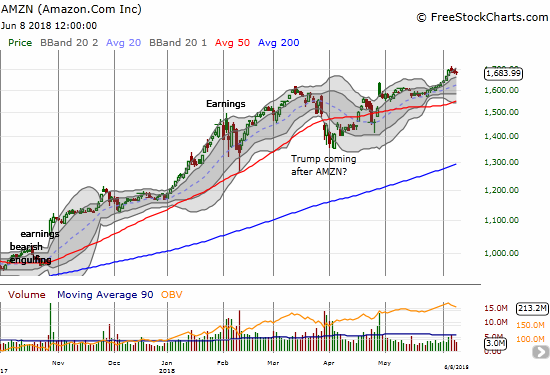
The short side of my calendar spread expired worthless, but I am now on the edge of my seat to see whether AMZN can return to its relentless upside behavior in the coming week. Last week, the stock surprisingly lagged the resurgence of tech stocks.
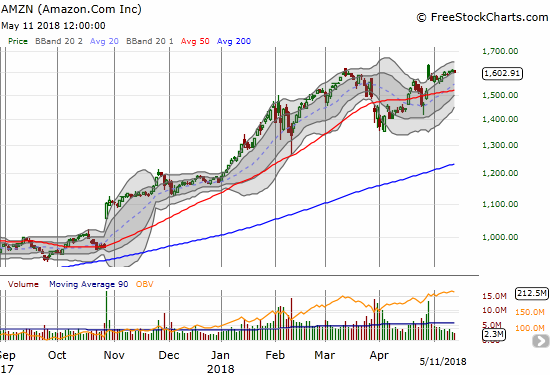
Amazon.com (AMZN) was one of the weaker big cap tech stocks. The stock almost reluctantly followed along the lower part of the upper-BB channel. Is the stock shying away from its post-earnings intraday high?
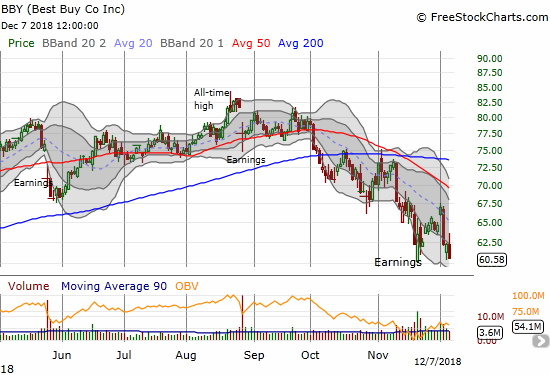
Best Buy (BBY)
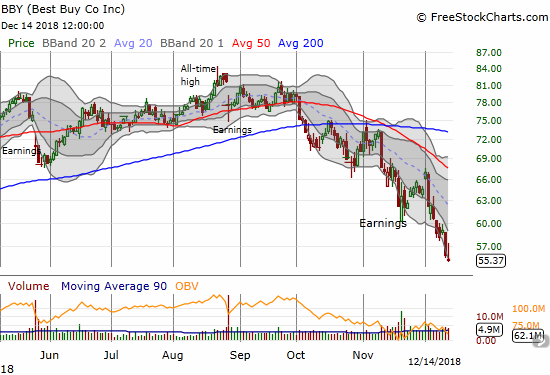
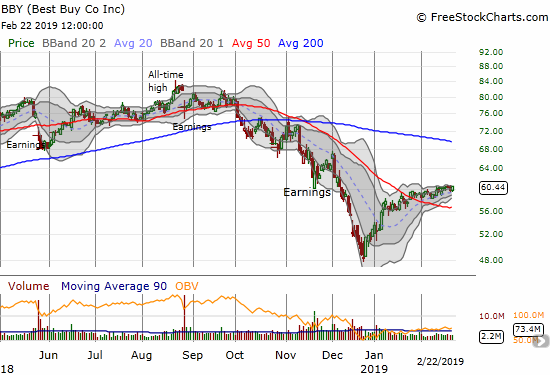
BBY continues to impress me. I never did jump into the middle of all this upward momentum, and I am regretting it. I just didn’t think the last dip gave me enough discount for the risk.
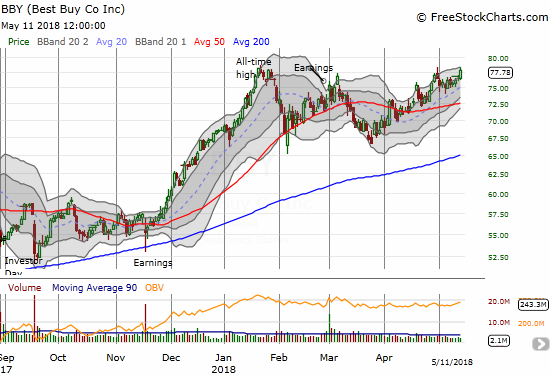
Best Buy (BBY) rallied just short of its all-time high. The uptrend from the March low has been remarkably consistent.
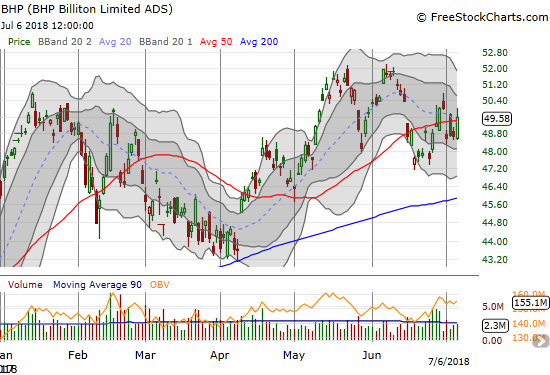
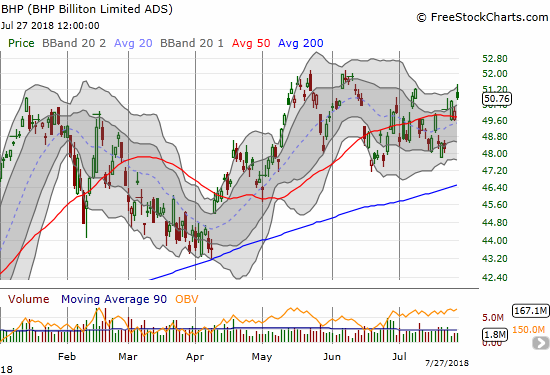
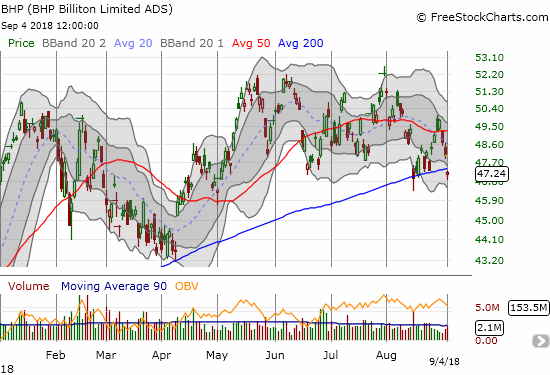
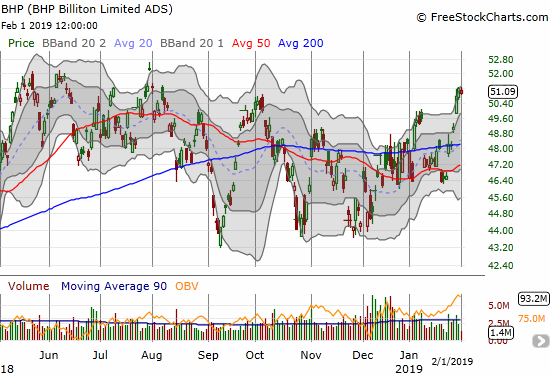
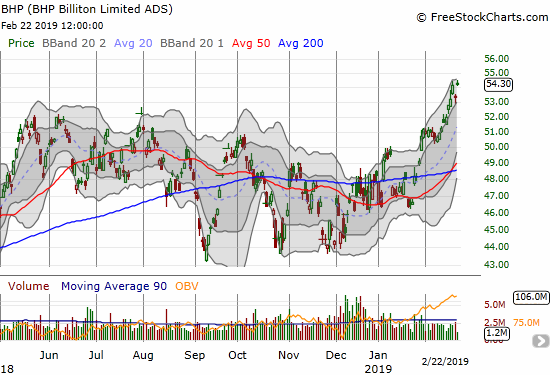
BHP Billiton (BHP)
Last week definitely put my bearish thesis to rest on BHP! The stock stumbled out the gate for the week but ended up soaring another 4.4% for the week thanks to a 3-day upward sprint. The stock faded from its high and is hanging out in very overbought territory.
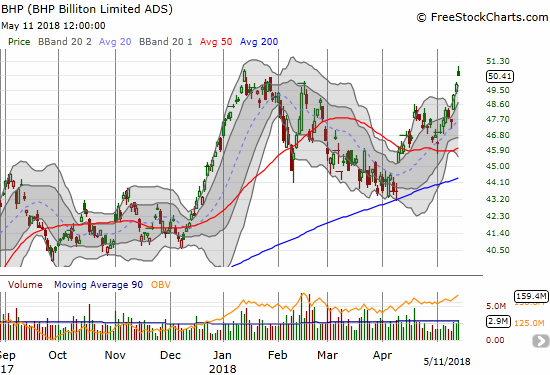
BHP Billiton (BHP) has a stellar week. The stock stopped just short of a new high for 2018. The gap up well above the upper-BB makes the stock extremely extended.
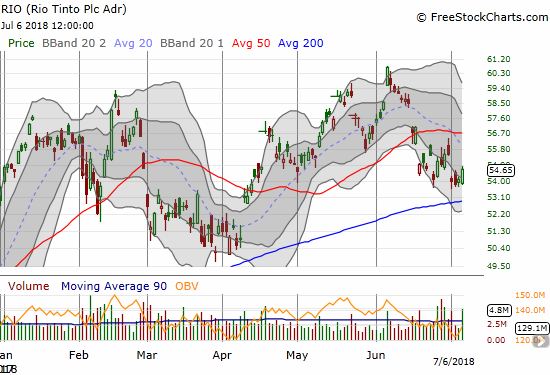
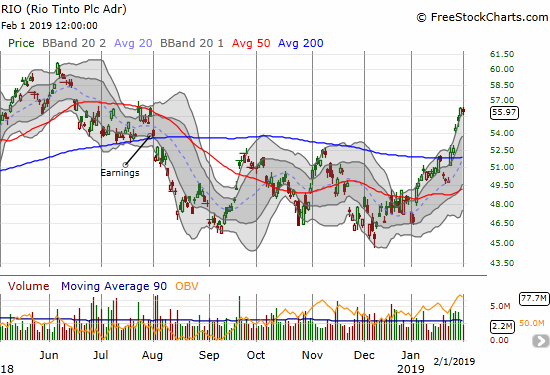
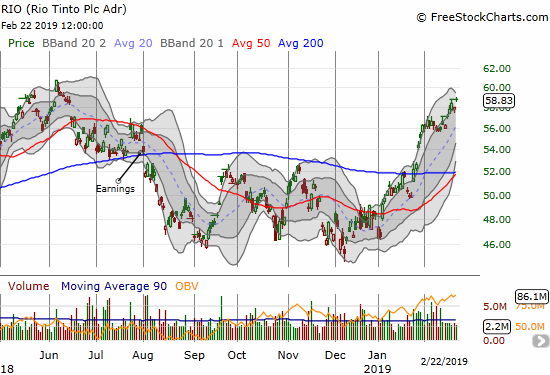
Rio Tinto (RIO)
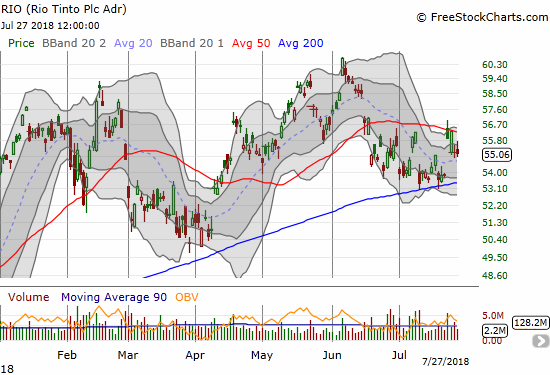
I have not activated the bullish side of the RIO vs BHP pairs trade because RIO has yet to break out to a new high. This week’s gains were not nearly as impressive as BHP’s since RIO’s Friday fade closed it out even for the day. So far then, RIO has stopped well short of a fresh breakout.
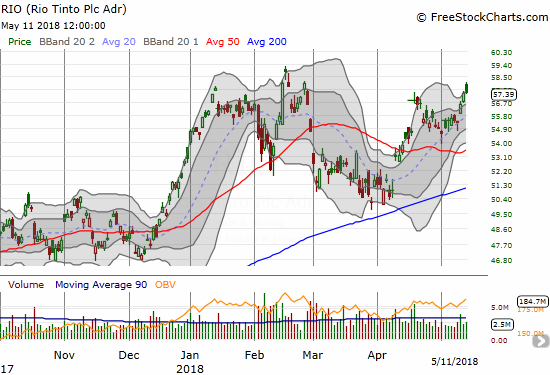
Rio Tinto (RIO) needs to keep rallying to avoid a toppy head and shoulders chart pattern.
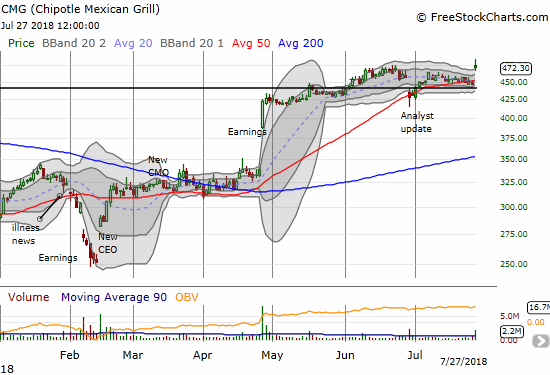
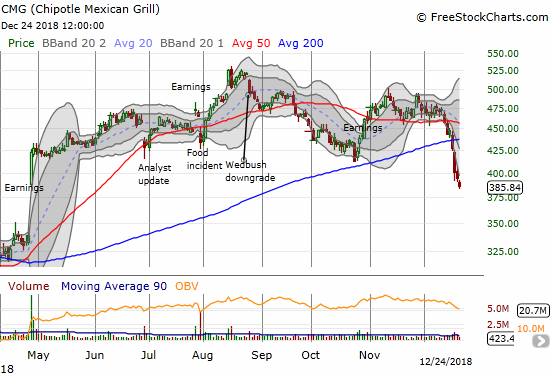
Chipotle Mexican Grill (CMG)
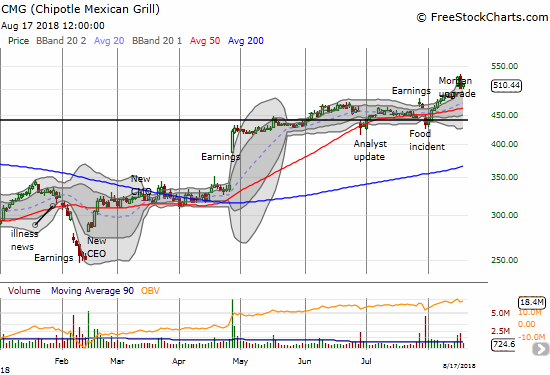
CMG faked me out last week as I made a failed attempt to play a fresh break out. I took a swing again for next week.
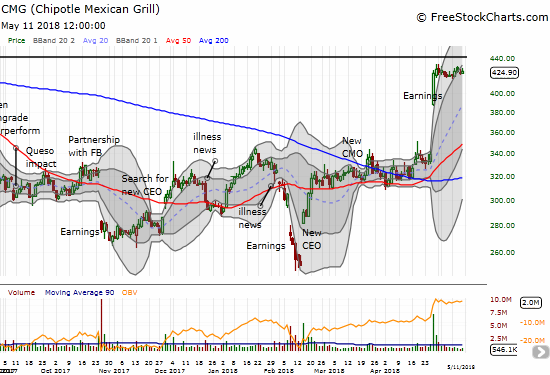
Chipotle Mexican Grill (CMG) almost looked ready to resume its post-earnings momentum. Now that it is lingering below the upper-BB channel, it is at greater risk for a pullback.
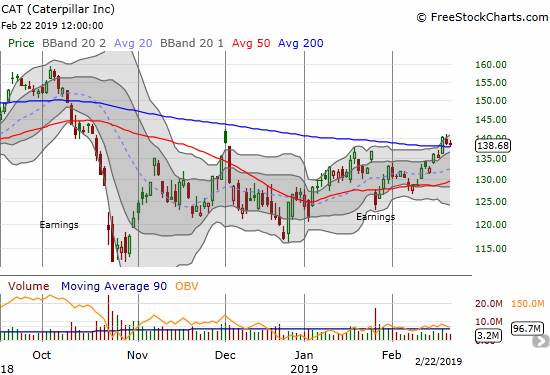
Deere (DE)
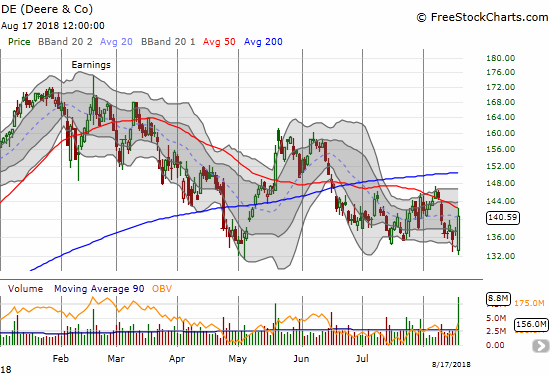
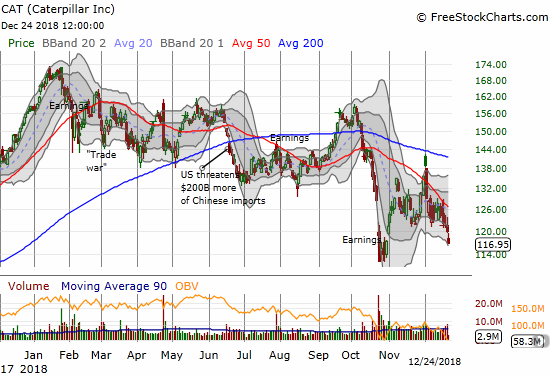
When DE broke down below its 200DMA, I thought it would take a very long time for the bearish move to reverse itself. The recovery took just two weeks. Still, the downtrending 50DMA looks like formidable resistance as most industrial stocks are facing challenges.
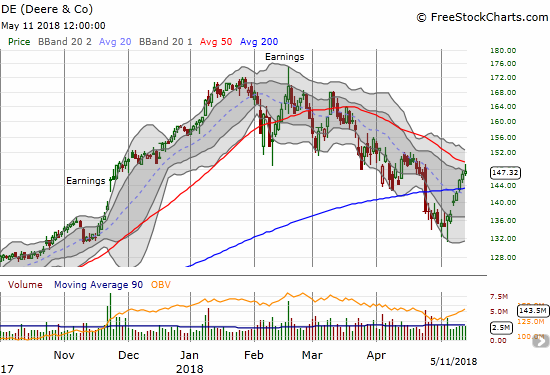
Deere (DE) is one of many industrial stocks struggling to break free of downtrends. While it faded from its rapidly downtrending 50DMA at least trading volume looks healthy and actually slowly increased this week.
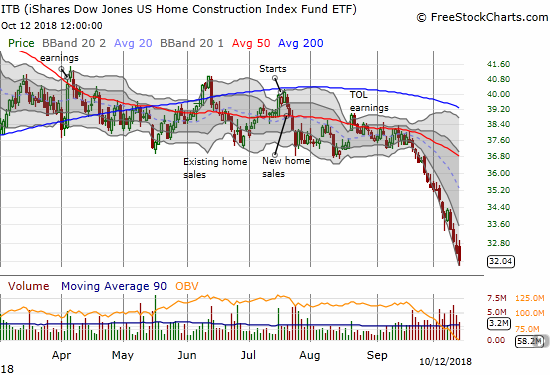
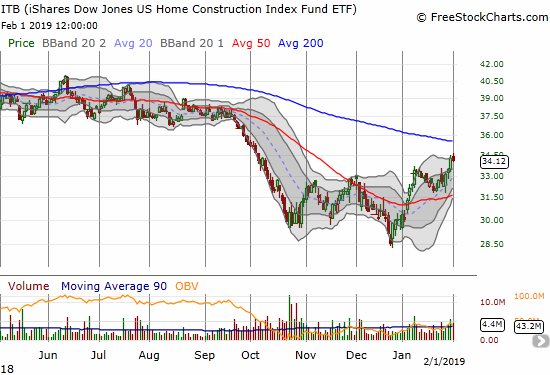
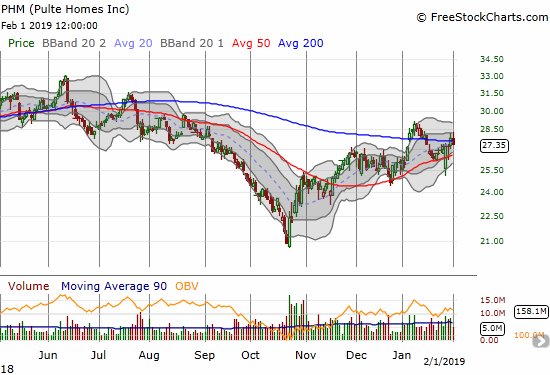
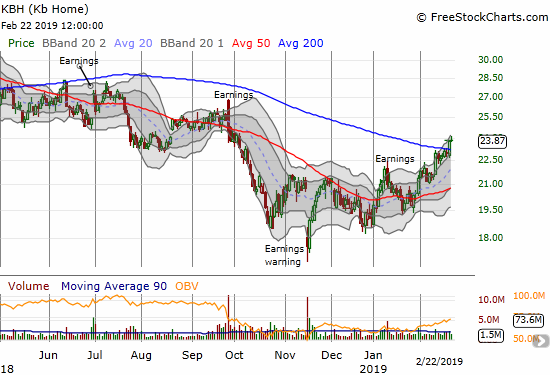
iShares US Home Construction ETF (ITB)
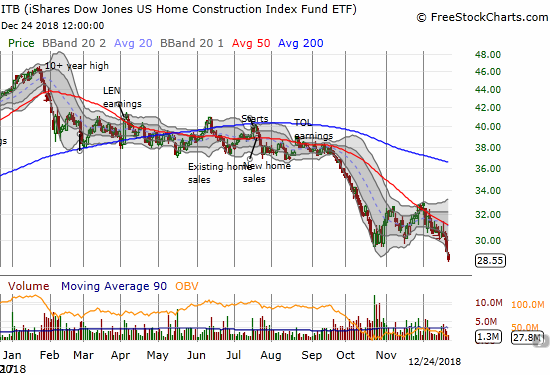
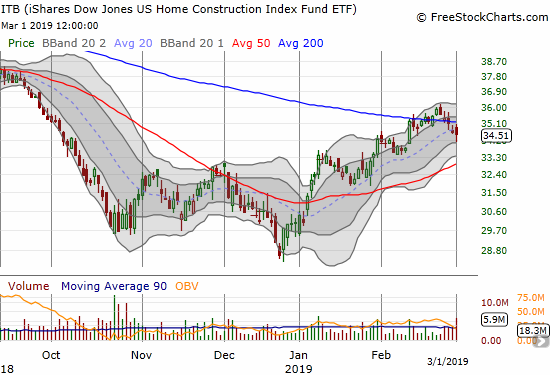
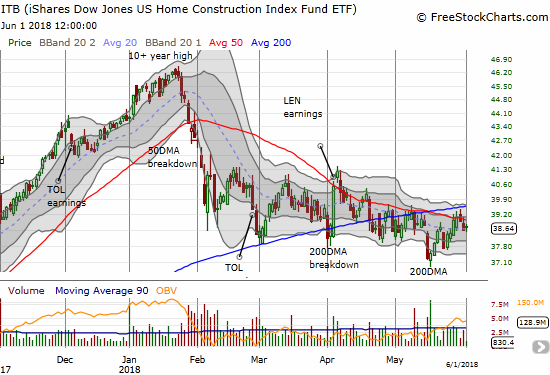
ITB continues to tantalize. Its individual components are swinging all over the place. The net result is an index that remains trapped in a tightening wedge pattern. The odds are still favoring the bears as ITB consistently fails to hold itself above its 200DMA.
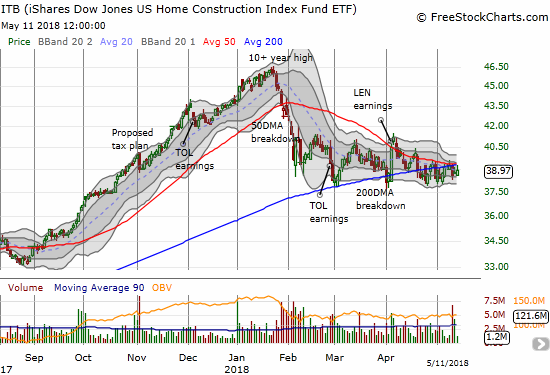
The iShares US Home Construction ETF (ITB) is as stuck as ever. Dangerously, it continues to linger just below its 200DMA as the 50DMA comes crashing down.
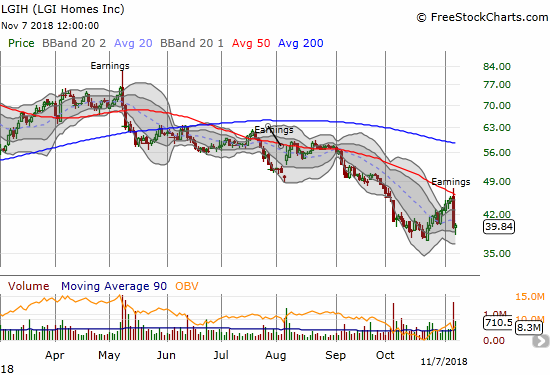
LGI Homes (LGIH)
My play on support for LGIH is hanging by a thin thread after the stock reversed sharply on Friday.
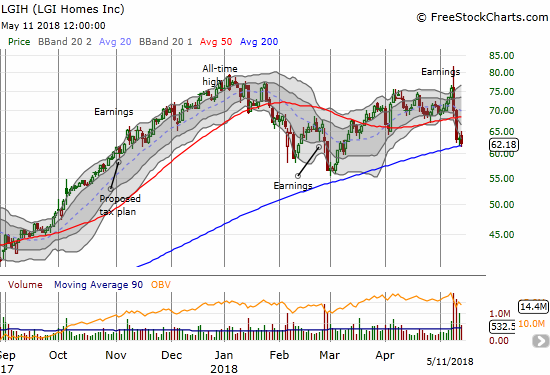
LGI Homes (LGIH) is clinging to 200DMA support. It is a stock desperately looking for a fresh catalyst in a market increasingly skeptical of home builders.
Monro (MNRO)
My play on support for MNRO worked out perfectly. I did not maximize profits, but I got a near double on my call options. I will take that reward any day.
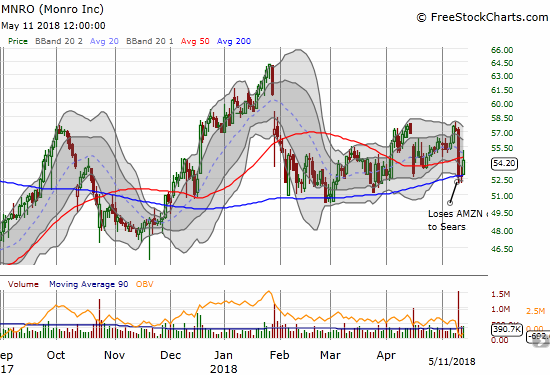
Monro (MNRO) bounced perfectly off 200DMA support.
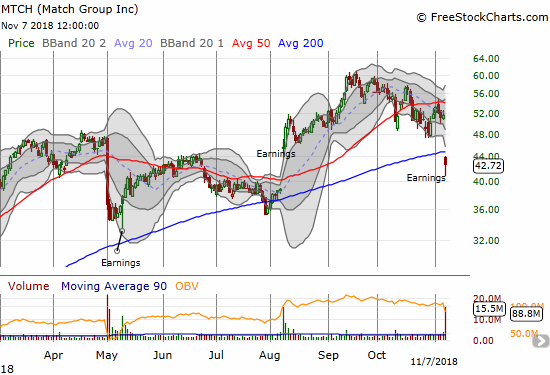
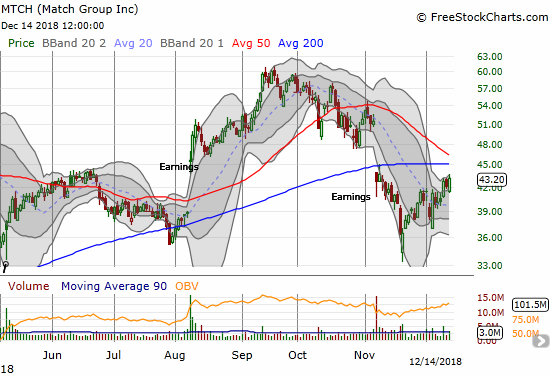
Match Group (MTCH)
MTCH suffered mightily after Facebook announced its entry into the world of online dating. Yet sellers could not follow through much after the first day of panic. So when the stock made a new low in the wake of earnings which came in just fine, I took a chance on buying call options. I was prepared to double down on a closer approach to 200DMA support, so I was quite startled when the buyers turned on the jets shortly after my buy to close the stock in positive territory on the day. I promptly took profits. When the buying continued the next day, I made a fresh trade and took profits on the subsequent Friday follow-through. With some analysts stepping up to defend MTCH now, I think it is good at least for a challenge of 50DMA resistance.
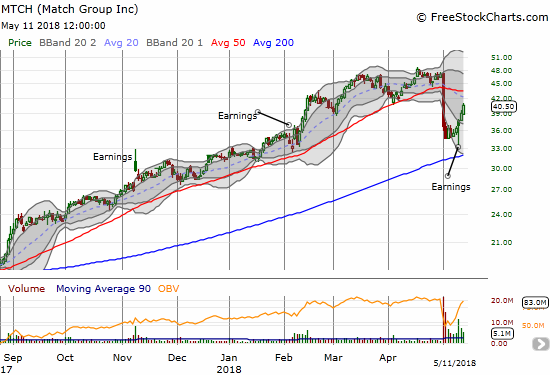
Match Group (MTCH) has likely bottomed. The negative pressure form the Facebook news is abating. Now investors will need to see actual results from Facebook’s efforts.
iPath Bloomberg Cocoa SubTR ETN (NIB)
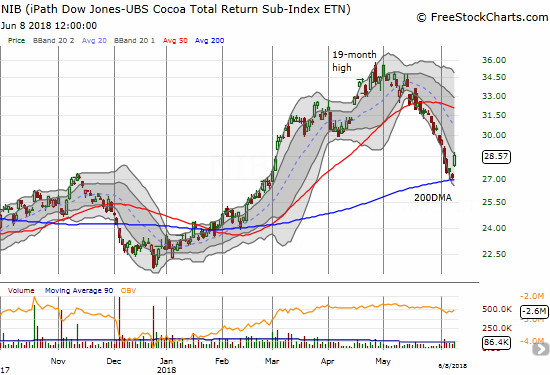
NIB surprised me a month ago when it broke through what I thought was a topping pattern. Now NIB is looking toppy all over again. The same fundamental catalysts are in place that formed part of my thesis of a top, so I will not be surprised to see the current swirl result in a true (short-term) top for NIB. Regardless, I think fresh buys here are too high risk for too little potential incremental reward. I am looking out for a resolution of a Bollinger Band (BB) squeeze.
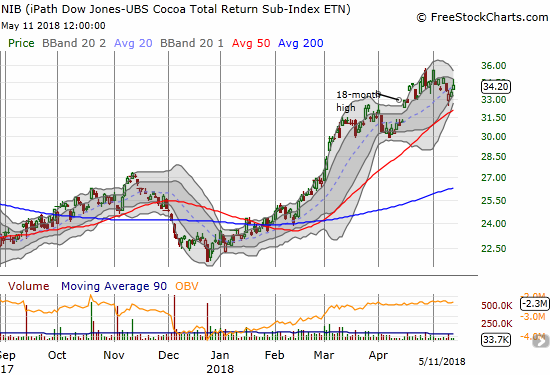
It is not quite a top but the churn and stalling at these lofty levels is starting to look more and more like one for iPath Bloomberg Cocoa SubTR ETN (NIB).
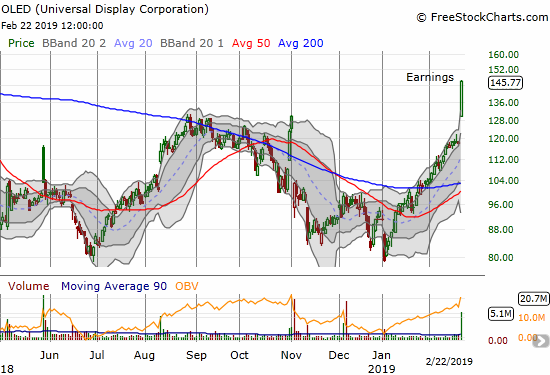
Impinj (PI)
PI is probably still my disaster of the year. So I got that sinking feeling when I realized that last week’s tremendous post-earnings rally was happening without me. I felt fortunate when the stock faded back to $17 where I had a limit order to buy waiting. I sold the very next day as the stock rallied well above its upper-BB again. I am looking to buy again…
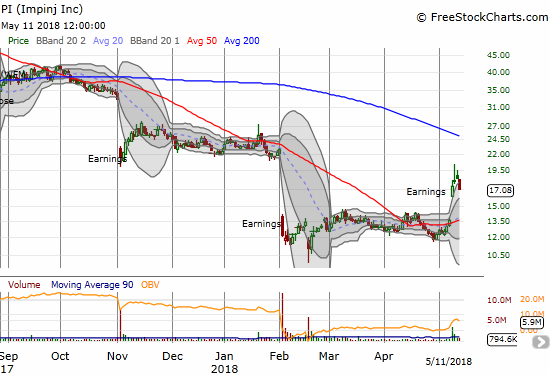
Impinj (PI) finally ended the negative pressure with a resounding post-earnings gap up and surge. It looks like the February gap down will eventually fill.
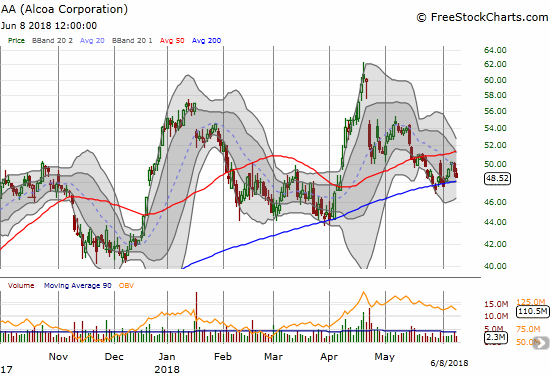
U.S. Steel (X)
I nailed the call for a rally to 50DMA resistance, but I failed to make the trade on X. Now the stock looks ready to reverse itself.
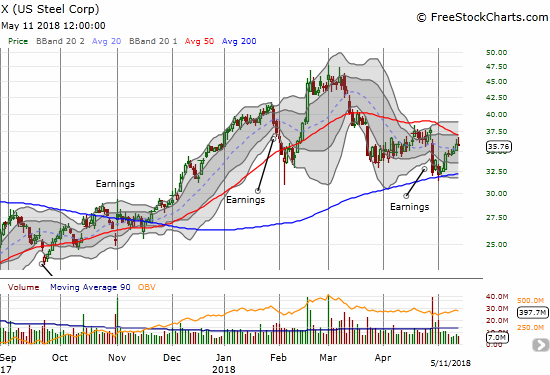
U.S. Steel (X) hit the 50DMA upside target…and looks ready to resume the selling.
Health Care Select Sector SPDR ETF (XLV)
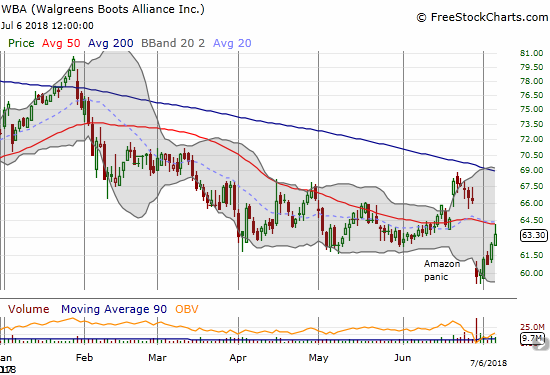
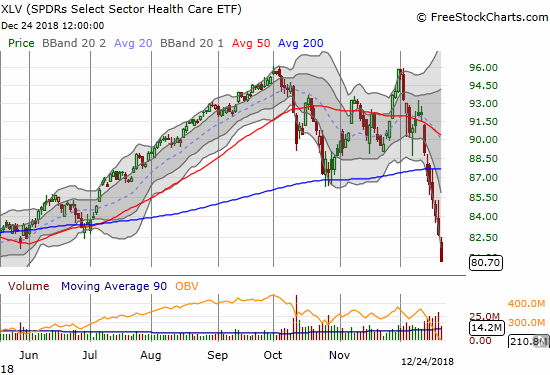
I remain bearish on XLV. This is one of the few plays where an Amazon panic led to sustained selling follow-through. Of course suffering an Amazon panic during a general market implosion is like a double whammy. XLV is one of the major indices that continues to lag the general market. It still looks bearish even with the strong end to last week’s trading.
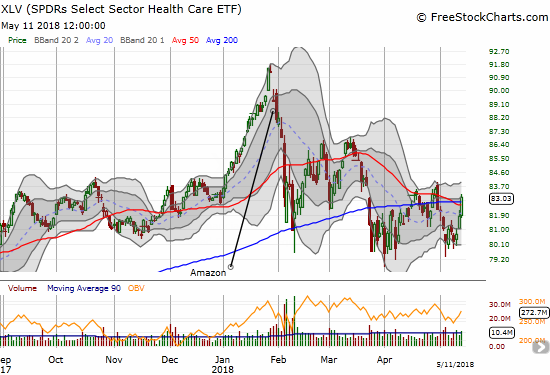
The Health Care Select Sector SPDR ETF (XLV) once again poked above 50 and 200DMA resistance levels. Can it next make a higher high on the way to a recovery?
— – —
FOLLOW Dr. Duru’s commentary on financial markets via email, StockTwits, Twitter, and even Instagram!
“Above the 40” uses the percentage of stocks trading above their respective 40-day moving averages (DMAs) to assess the technical health of the stock market and to identify extremes in market sentiment that are likely to reverse. Abbreviated as AT40, Above the 40 is an alternative label for “T2108” which was created by Worden. Learn more about T2108 on my T2108 Resource Page. AT200, or T2107, measures the percentage of stocks trading above their respective 200DMAs.
Active AT40 (T2108) periods: Day #60 over 20%, Day #29 over 30%, Day #24 over 40%, Day #6 over 50%, Day #3 over 60% (overperiod), Day #74 under 70%
Daily AT40 (T2108)
")
Black line: AT40 (T2108) (% measured on the right)
Red line: Overbought threshold (70%); Blue line: Oversold threshold (20%)
Weekly AT40 (T2108)

*All charts created using freestockcharts.com unless otherwise stated
The charts above are my LATEST updates independent of the date of this given AT40 post. For my latest AT40 post click here.
Related links:
The AT40 (T2108) Resource Page
You can follow real-time T2108 commentary on twitter using the #T2108 or #AT40 hashtags. T2108-related trades and other trades are occasionally posted on twitter using the #120trade hashtag.
Be careful out there!
Additional disclosure: long AAPL call options, long BHP puts, long LGIH, long AMZN call, long CMG calls, short FB shares and long call spread
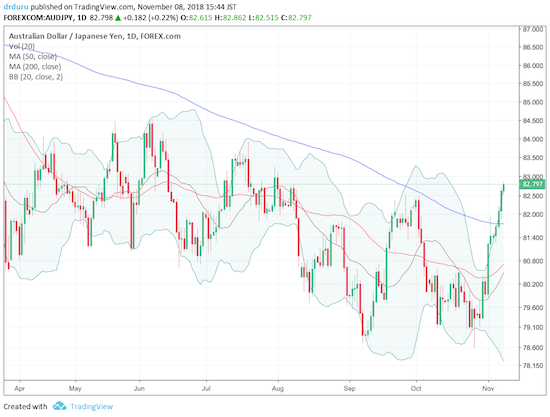
*Charting notes: FreeStockCharts.com stock prices are not adjusted for dividends. TradingView.com charts for currencies use Tokyo time as the start of the forex trading day. FreeStockCharts.com currency charts are based on Eastern U.S. time to define the trading day.

 will arrive back home this afternoon and we want you there when the squad arrives!