A promising week of post-oversold trading ended in tensions over inflation, interest rates, and Ukraine. Overall, the stock market remains locked in churn. Yet, the view from individual stocks can provide cause for greater alarm. End of the week selling in big cap tech raised a red flag against my overall bullishness in this period. Flagship stocks like Apple (AAPL) and Amazon.com (AMZN) suffered heavy losses right at important tests of support and resistance respectively. I am particularly Apple wary because the stock is owned by so many and can impact overall investor sentiment. The resilience of small cap stocks keep me hopeful that the coming week will deliver a reversal of last week’s disappointments. If not, then sellers may quickly test support on the major indices at the bottom of their churn zones.
Stock Chart Reviews – Below the 50-day moving average (DMA)
Apple Inc (AAPL)
Apple (AAPL) spent the month trying to follow through on its breakout above its 50-day moving average (DMA) (the red line below). On Friday, AAPL gave up and instead broke down. I am Apple wary because this breakdown opens up the opportunity for sellers to press AAPL into a reversal of the oversold bounce. As a widely held big cap tech stock, AAPL’s fortunes can impact sentiment. AAPL’s important failure is a sign of validation for more market churn ahead. However, bears have a lot more to prove as a test of the 2022 lows would likely coincide with a test of 200DMA support (the blue line below).
Apple Inc (AAPL) finally failed its test of 50DMA support with a 2.0% loss.
Amazon.com (AMZN)
Amnazon.com (AMZN) followed through on its post-earnings surge, but the big cap tech stock ran smack into 50DMA resistance. Intrepid bears should have jumped on the confirmation from the gap down the next day. AMZN delivered for those bears with a 3.6% loss to end the week. Like my feeling “Apple wary”, AMZN’s failure of an important technical test maintains the narrative of market churn.
Post-earnings momentum came to an end for Amazon.com (AMZN) right at 50DMA resistance. Follow-through selling confirmed resistance.
Meta Platforms, Inc (FB)
Meta Platforms, Inc (FB) failed an important test at 50DMA resistance with a gut-wrenching 26.4% post-earnings loss. FB’s next test is its pre-pandemic high. The first bounce attempt disintegrated into a second close below that important milestone. Churn for FB may just be a pivot around the pre-pandemic high.
Meta Platforms Inc (FB) ended the week with a convincing close below its pre-pandemic high and a 20-month low.
Twitter Inc (TWTR)
Twitter Inc (TWTR) is another victim of the return to pre-pandemic highs. TWTR tried to hold the line in early January. Last week’s post-earnings trading confirmed stiff resistance at the pre-pandemic high.
Twitter Inc (TWTR) has spent most of 2022 trading below its pre-pandemic high. A pre-earnings test of this line turned into a post-earnings 3.3% loss.
Maxeon Solar Technologies, Inc (MAXN)
My hopeful observations of the November post-earnings bounce for Maxeon Solar Technologies, Inc (MAXN) disintegrated quickly. Sellers took over from there and compressed MAXN below its 20DMA (the dotted line below). Now trading around all-time lows, there is no telling when or how the bleeding will stop. I am only hanging on because of my stubborn long-term bullishness for quality solar companies.
Maxeon Solar Technologies, Inc (MAXN) remains stuck in a 3-month downtrend after November earnings provided 2 days of gains. MAXN trades at all-time lows.
Red Robin Gourmet Burgers, Inc (RRGB)
I last reviewed my favorite burger franchise Red Robin Gourmet Burgers, Inc (RRGB) back in September (7:04 mark of the video). The covered call did indeed burn off, but the inability of RRGB to make a firm stand on a test of the September lows motivated me to take my remaining profits on the small rally into November earnings. I have yet to see a convincing re-entry point. A 2022 high would solidly confirm a 50DMA breakout and bring me back in. Otherwise, I might try bottom-fishing on a test of the November, 2020 lows.
Since peaking last March, Red Robin Gourmet Burgers, Inc (RRGB) has been unable to shake a relentless downtrend defined by a declining 50DMA.
Twilio Inc (TWLO)
Twilio Inc (TWLO) put on a bearish display with an awful post-earnings fade. In the after-hours, TWLO was up 19.1%. It opened the next day up 14% right below 50DMA resistance. Sellers took over from there. The dust settled with a near flat close for the day. Sellers continued with a 7.3% pullback that solidly planted TWLO back into its own churn zone. TWLO is down 27.5% year-to-date.
Twilio Inc (TWLO) stopped cold at 50DMA resistance with a 15.6% post-earnings gain. Sellers took over from there with a near complete fade and bearish follow-through the next day with a 7.3% loss.
Affirm Holdings, Inc (AFRM)
Affirm Holdings, Inc (AFRM) made one of those rare and embarrassing gaffes by prematurely releasing earnings results. The algos must have gone wild. AFRM suddenly soared about 10% right into 50DMA resistance and then collapsed. Perhaps the algos that trade off headlines saw something good and the algos that read more content saw the ugly. AFRM closed the day down 21.4%. That destructive earnings pricing did not end. After a brief pause at Friday’s open, sellers took AFFRM down another 20.7% to an all-time low. The hype over buy-now, pay-later is apparently evaporating almost as quickly as it ignited.
Affirm Holdings, Inc (AFRM) traveled from an 11.9% pre-earnings gain to a 21.4% post-earnings loss on the same day after a pre-mature earnings release. The next day sellers took AFRM down another 20.7% to an all-time low.
Confluent,Inc (CFLT)
Real-time data streaming software company Confluent, Inc (CFLT) was looking good going into earnings all things considered. A 21.9% post-earnings loss took CFLT back to its lows of the year. At 57 times sales, CFLT needs to report perfection in a stock market fleeing from expensive growth stocks. Headline earnings and quarterly guidance looked good against “consensus”, but CFLT will show red ink as far as the eyes can see.
Confluent, Inc (CFLT) was vying for a bullish continuation of its latest 50DMA breakout until a 21.9% post-earnings loss.
The Goodyear Tire & Rubber Company (GT)
The Goodyear Tire & Rubber Company (GT) imploded 27.4% post-earnings. I cannot tell what happened from the Seeking Alpha earnings summary. Accordingly, I am wondering whether this breakdown is actually a buying opportunity. GT sells for just 0.3 times sales and 7.6 times forward earnings. Of course, GT could be cheap for a reason. Perhaps investors are getting ahead of a peak in auto sales, for example.
The Goodyear Tire & Rubber Company (GT) looked relatively stable after November earnings. February earnings flipped the script with a 27.4% loss and breakdowns below the 50 and 200DMAs.
Editas Medicine, Inc (EDIT)
As a genome editing company, Editas Medicine, Inc (EDIT) represents the future of medicine. EDIT is even still a fractional holding in ARK Genomic Revolution ETF (ARKG). Unfortunately, with no profits and a high multiple on sales, the market has become impatient with this clinical stage company. Sellers have been near relentless since the November earnings report. EDIT now trades close to where it dropped during the stock market crash of March, 2020.
I was fortunate to have EDIT shares in play for the stock’s run-ups. My luck ran out with my latest trade betting on a hold at the lows of 2021. I will only add if EDIT convincingly holds support from the March, 2020 lows.
Editas Medicine, Inc. (EDIT) had wild rides in 2021, but relentless selling in 2022 has taken EDIT to prices last seen near the depths of the 2020 stock market collapse.
2U, Inc (TWOU)
I was going to ignore the catastrophe in 2U, Inc (TWOU), but I noticed three ARK funds have fractional holdings in TWOU. ARK investments sends out notes when a holding moves more than 15% up or down. Here is ARK’s note on TWOU:
“Shares of 2U, a digital education platform provider, fell 47% on Thursday despite the company reporting stronger than expected earnings that were tempered by lower than consensus guidance. Because of 2U’s acquisition of edX, its operational costs will be higher than expected.”
For a stock that plunged this much to all-time lows, I want to know whether ARK thinks the stock is a steal here. I have other investments in education stocks, and I decided to trim TWOU last year as the biggest loser of the bunch. The unfolding disasters in these kinds of stocks are stark reminders for listening to the trends. I am still learning to be more consistent about following the signs!
2U, Inc (TWOU) created a major fake-out with a rally into 50DMA resistance ahead of a 47.9% post-earnings loss. TWOU closed the week at an all-time low.
iShares 20+ Year Treasury Bond ETF (TLT)
Inflation fears are higher than last year. The Federal Reserve is actually tightening monetary policy instead of the market just fearing tightening a year ago. Yet, long-term interest rates are hardly higher than the 2021 highs. The 20-year Treasury hit 2.37% last Thursday. The high was 2.36% last year. The 10-year Treasury hit 2.03% last Thursday. The high was 1.74% last year. The 10-year was last this high at the end of July, 2019.
Source: Board of Governors of the Federal Reserve System (US), Market Yield on U.S. Treasury Securities at 20-Year Constant Maturity [DGS20], Market Yield on U.S. Treasury Securities at 10-Year Constant Maturity [DGS10, Market Yield on U.S. Treasury Securities at 2-Year Constant Maturity [DGS2 retrieved from FRED, Federal Reserve Bank of St. Louis; February 13, 2022.
The current trend is up as expected. However, these levels tell me the market is reluctant to bet on a strong economy at the other end of monetary tightening (or whatever the Fed actually does). In the meantime, the 2-year, which is most sensitive to monetary policy, is racing higher. I have even heard talk of the potential for an inverted yield curve. An inverted yield curve is associated with a heightened risk of recession.
The iShares 20+ Year Treasury Bond ETF (TLT) actually rallied 1.4% on Friday (TLT goes higher when rates go lower). At this point in the economic cycle, an extended rally in TLT should be interpreted as bearish even if stocks enjoy the ride for a bit. I want to see rates at least hold where they are.
The iShares 20+ Year Treasury Bond ETF (TLT) jumped 1.4% after testing the May, 2021 lows despite rate and inflation fears soaring to much higher levels than last year.
Stock Chart Reviews – Above the 50DMA
Skechers U.S.A., Inc (SKX)
It is hard to find stocks breaking out above their 200DMAs. Athletic shoe company Skechers U.S.A., Inc (SKX) happens to be one of those stocks. SKX is riding post-earnings momentum. However, a 2.0% pullback on Friday threatens to bring the revival to an end. Otherwise, SKX looks like a buy here.
Skechers U.S.A., Inc (SKX) ran with post-earnings momentum to a 200DMA breakout. Despite confirming the breakout, SKX turned around and lost 2.0%.
United Parcel Service, Inc (UPS)
I thought the post-earnings breakout in United Parcel Service (UPS) was a sign of a healthy economy. That assumption was put to the test in last week’s selling. UPS came close to testing 50DMA support. I am looking for a convincing rebound to signal a buying opportunity.
United Parcel Service, Inc (UPS) failed to sustain post-earnings momentum and is suddenly rushing to test 50DMA support with a 3.3% loss to end the week.
*Charting notes: Stock prices are not adjusted for dividends. Candlestick charts use hollow bodies: open candles indicate a close higher than the open, filled candles indicate an open higher than the close.
I earlier wrote about a promising divergence between anxiety and breadth in the stock market. However, I cannot help rubbernecking the market’s crashes and accidents. They tell dramatic stories about the folly in price action that can come with easy monetary policy and free money. The market goes through cycles of excitement about the latest and greatest ideas, services, and products where valuation means little to nothing. The deflation is inevitable yet few dare predict it because the force of momentum is powerful. The doomsayers look more and more foolish as prices just keep rising. Yet, here we are. Entire swaths of growth stocks have crashed and returned all their pandemic era gains. The lessons of old still reign supreme. The next lesson is to remember that market sentiment goes to extremes on the upside and downside. So now is the time to contemplate what gold nuggets are trying to shine through the rubble of these crashes and accidents.
Stock Chart Reviews – Below the 50-day moving average (DMA)
Apple Inc (AAPL)
A week ago I was “Apple Wary.” Apple (AAPL) provided brief relief with a two-day rebound back to resistance at its 50-day moving average (DMA). My wariness quickly returned as AAPL confirmed resistance with two lower closes. AAPL even finished the week with its lowest close of the month. A good amount of market sentiment hangs in the balance of what AAPL does next.
Apple Inc (AAPL) ended the week with a confirmed 50DMA breakdown. This event makes me Apple Wary all over again.
Meta Platforms, Inc (FB)
Sellers remain relentless in Meta Platforms, Inc (FB). With the stock trading well below its pre-pandemic high and with no sign of stabilization, the lows from the stock market crash are actually in play. Such an event would be a fresh calamity, so I still consider it an extreme of extremes. In the meantime, I expect the pre-pandemic high to act as stiff resistance to relief rallies.
Meta Platforms Inc (FB) selling continues apace. At this rate of decline the pre-pandemic high looms as larger and larger overhead resistance.
New Relic, Inc (NEWR)
Dev ops software company New Relic, Inc (NEWR) is a different case of a stock that crashed into and then below its pre-pandemic high. NEWR never quite broke away from that threshold until a near-parabolic run into its November earnings report. Buyers were rewarded with a 38.5% post-earnings gain. Yet, as in so many similar cases, NEWR gave an early warning by failing to close at a fresh high. Now NEWR is right back in the middle of the churn that has defined most of the pandemic-era trading in the stock.
New Relic, Inc (NEWR) took over 18 months to separate from its pre-pandemic high thanks to November earnings. A 28.4% post-earnings loss brought NEWR right back to its pivot.
Twilio Inc (TWLO)
The selling continues in Twilio Inc (TWLO). Incredibly, even TWLO is now on the edge of a full reversal of its pandemic era gains. At 12x sales TWLO is getting more “fairly” valued. However, operating losses are growing faster than revenue: from 2020 to 2021, Twilio’s operating losses ballooned by 107% versus 61% revenue growth. This negative dynamic needs to show signs of reversing before I go from rubbernecking to buying this accident of fortunes. A greater discount in the valuation can also make up for the poor operating numbers.
Twilio Inc (TWLO) continues to suffer from a vicious post-earnings fade. TWLO is now staring down a test of its pre-pandemic high with a 64.3% drawdown from the all-time high.
Shopify, Inc (SHOP)
I consider Shopify, Inc (SHOP) to be one of the grand darlings of the pandemic era. E-commerce naturally soared and more and more people looked to running their own businesses as an alternative or supplement to a pandemic burdened economy. However, even SHOP is on the verge of testing its price from its pre-pandemic high. SHOP is still a pricey 25x sales even though it is growing operating income. I am content to keep rubbernecking on this one.
1. Shopify stock is down 50% over the past 12 months. Its mission may be to "arm the rebels," but it is giving us muskets in a war that is increasingly being fought with machine guns.
Shopify, Inc (SHOP) lost 16.0% post-earnings and is staring down an eventual test of its pre-pandemic high. This development is one of the most startling of the pandemic-era darlings. SHOP is down 61.1% from its all-time high.
Warner Music Group Corp (WMG)
After a secondary offering, Warner Music Group Corp (WMG) delivered a disappointing earnings report in November. WMG has not been the same since that 6.2% post-earnings loss. My rules on trading around secondary offerings saved me from getting caught. WMG had a poor response to its February earnings report (down 6.9%), so I have cooled my heels on looking for a new entry point to buy shares. I do not know yet at what point I will stop rubbernecking on WMG.
Warner Music Group Corp (WMG) reversed its breakout this year. Earnings delivered a 6.9% loss and reduced the odd of a comeback anytime soon.
DoorDash (DASH)
DoorDash (DASH) punched its ticket along with other high profile stocks that first surged post-earnings and then crashed. DASH gained 26% after hours following earnings. DASH opened the next day with a 22% gain but a strong fade took DASH down to an 11% post-earnings gain. Sellers on Friday wiped out the rest of those gains. If TWLO is an example of what happens after such a vicious post-earnings fade, sellers will take DASH to new all-time lows in the coming week. DASH can return to a bottoming pattern by closing above its post-earnings intraday high. A confirmed 50DMA breakout would be even better.
DoorDash, Inc (DASH) reversed an initial 21.8% post-earnings open. DASH is now poised to make new all-time lows.
Fastly, Inc (FSLY)
Edge cloud platform company Fastly, Inc (FSLY) not only sliced through its pre-pandemic high, but also the stock is nearing its $16 IPO price. At the time of the IPO, May 17, 2019, FSLY closed the day at $23.99. I had my eye on the stock and the company, but I was unwilling to pay up. From there, I traded in and out of FSLY but failed to enjoy the full run-up to the stratospheric all-time of $128.83. I have been rubbernecking ever since. After the most recent post-earnings disaster, this time a 33.6% loss, FSLY seems fairly priced at 9.5 times sales. As with so many of these profitless, growth software companies, the looming question is when will the company figure out how to earn net profits. The word “profit” only appeared once in the transcript of the earnings call:
“I think the other thing is we’re seeing a lot more discipline from some of the competitors in this space. We’re seeing a renewed focus on ensuring that the business that they do is profitable. And that’s good for, I think, for everyone.”
Fastly, Inc (FSLY) lost 33.6% post-earnings in a further confirmation of the on-going downtrend. FSLY is closing in on its $16 IPO price.
Amplitude, Inc (AMPL)
It sounds strange, but the best IPOs are those that return to rational pricing as soon as possible: fewer individual investors get caught up in the misplaced hype. Product analytics software company Amplitude (AMPL) rolled out a direct listing in the final weeks of the market’s interest in expensive growth companies. AMPL soon soared 54.7% to its all-time high right before its first earnings report. A second earnings report later and reality has taken AMPL to a 75.6% collapse from that all-time high. The stock still trades at 31x sales, so the stock still has plenty of valuation compression to go in this market. With operating losses, negative cash flow, and a need to keep investing in the business, the juicy 70%+ gross margins may not be enough to keep current buyers interested. From the Seeking Alpa transcript of the earnings call:
“As a result, loss from operation in the fourth quarter was $5 million compared to a loss of $0.2 million last year. Operating margins at negative 10% compared to negative 1% in the same period as we accelerated growth, the investment for growth. Net loss was $5.4 million compared to $0.5 million in the fourth quarter of 2020. Net loss per share was $0.05 based on 107.9 million shares compared to $0.02 in the fourth quarter of 2020 based on 26 million shares.
Turning to free cash flow. Free cash flow was negative $12.2 million or negative 25% of revenue compared to negative $3.8 million or negative 13% of revenue. In the fourth quarter of 2020 and full year 2021, free cash flow was negative $34.9 million or negative 21% of revenue. Note that Q4 and full year 2021 free cash flow includes approximately $6.5 million and $18.2 million in direct listing expenses respectively. Adjusting for this, our free cash flow margin would have been negative 12% in Q4 and negative 10% for the year.”
Amplitude, Inc (AMPL) shows the importance of timing. AMPL debuted during the last wave of “valuation means nothing” trading. Two earnings reports later, AMPL is down 75.6% from its all-time high.
Crocs, Inc (CROX)
A friend and I had a running joke about last year’s simple winning formula: pizza and Crocs (CROX). Pizza referred to Dominos Pizza (DPZ) which gained 47.2% in 2021. CROX enjoyed an eye-popping, year-to-date 188% gain at its all-time high before gravity took over. If only simple ideas were so obvious before hindsight. Both stocks are now coming back down to earth at a rapid clip. CROX sold off sharply to end the year and is down another 38% year-to-date on the heels of a poorly received earnings report. Suddenly, CROX is closing in on a full reversal of its hard-earned 2021 winnings.
Crocs, Inc (CROX) followed an initial 6.4% post-earnings loss with a larger 13.4% plunge. With the April, 2021 post-earnings gap filled, CROX looks like another bubble bursting. CROX is down 56.1% from its all-time high.
Roku, Inc (ROKU)
I am now in the habit of checking ETF ownership of stocks that suffer big losses. I was quite surprised to see that ROKU is a main holding of two ARK funds: ARK Innovation ETF (ARKK) has a 6.3% allocation to ROKU and ARK Next Generation Internet ETF (ARKW) has a 5.8% allocation. These are the two highest allocations among ETFs. I am not sure what is so innovative about Roku relative to other streaming platforms, but I do know that consumer hardware products and companies have a very difficult time staying viable over the long-term. The market is brutally competitive market with margins often under attack.
On Friday, ROKU suffered a 22.3% post-earnings loss and swiftly left behind its pre-pandemic high in the rearview mirror. Here is what ARK had to say about ROKU’s punishment (from their email report):
“Shares of Roku traded down 22% Friday after the company reported fourth quarter earnings with lower than expected 33% revenue growth and guidance for further deceleration to 25% for the first quarter. Management cited supply chain bottlenecks and inventory shortages at its TV OEM partners that have impacted sales of smart TVs. Management noted that active accounts increased to more than 60 million, surpassing the number of video subscribers combined at all the cable companies in the US. Although US consumers spend 45% of their viewing hours on streaming TV today, advertising on streaming TV accounts for only 18% of total TV advertising budgets, a gap we expect to close. Roku is the leading TV operating system in the US and is beginning to scale internationally.”
Clearly, ROKU will remain a major allocation in the ARK funds for some time to come as they await the promise of the international expansion. ROKU is at least now below 10x sales.
Roku, Inc (ROKU) adds a double-top to its burst bubble. A 22.3% post-earnings loss pushed ROKU well below its pre-pandemic high.
Okta, Inc (OKTA)
Authentication and software company Okta, Inc (OKTA) closed the week at a 21-month low. That puts OKTA within a 14% loss of its pre-pandemic high. After its February, 2021 peak, OKTA actually looked like it was stabilizing going into the close of 2021. Unfortunately, with a high valuation of 23x sales and big operating losses, odds favor OKTA finishing its reversal of its pandemic era gains.
Okta, Inc (OKTA) is grinding its way lower and lower toward its pre-pandemic high. OKTA trades at a 21-month low.
Moderna, Inc (MRNA)
Moderna, Inc (MRNA) helped bring us out of the pandemic with its vaccines, so the euphoria expressed in the shares was understandable. Now MRNA is 70.0% off those euphoric all-time highs. The crash in shares has taken MRNA back to April, 2021 levels. Given the extremes, MRNA is back on my radar. The valuation is even down to reasonable levels at 5.1 times sales and an 8.7 P/E. The question of course is whether Moderna can extend its success past COVID. That goal is exactly on the company’s docket. From a Friday press release:
“…expanding its mRNA pipeline with three new development programs. This announcement reflects the Company’s commitment to expanding its portfolio building on Moderna’s experience with Spikevax®, its COVID-19 vaccine. The development programs announced today are mRNA vaccine candidates against herpes simplex virus (HSV), varicella-zoster virus (VSV) to reduce the rate of shingles and a new checkpoint cancer vaccine. HSV and VZV are latent viruses that remain in the body for life after infection and can lead to life-long medical conditions. Moderna now has five vaccine candidates against latent viruses in development, including against cytomegalovirus (CMV), Epstein-Barr virus (EBV), Human immunodeficiency virus (HIV), HSV and VZV.”
The lack of market response is telling of just how negative sentiment has gotten on MRNA. I am moving from rubbernecking to looking for an entry.
Moderna, Inc (MRNA) has come all the way back to prices last seen April, 2021. The stock is tempting here given that time was a period of stabilization. MRNA is 70.0% off its all-time high.
Zillow Group (ZG)
Real estate services company Zillow Group (ZG) crashed and burned in November. The moment was one of reckoning for a broken business model. The moment also flagged why we technicians care about trends. Since ZG’s peak with February, 2021 earnings, sellers told us everything we needed to know. I wish I left ZG at rubbernecking, but I thought the initial panic over iBuying was the extent of the reckoning. I bought in too early, but I dared to accumulate post-earnings. Fast forward to the latest earnings and Zillow Group (ZG) finally put in a good report. ZG gained 12.7% and has a confirmed 50DMA breakout. The stock may not have much more short-term upside from here given the headwinds in the housing market, but at least ZG looks like it is stabilizing.
Zillow Group (ZG) finally had another good post-earnings response. ZG gained 12.7% post-earnings and then confirmed a 50DMA breakout.
Caterpillar, Inc (CAT)
Caterpillar, Inc (CAT) provided a brief bullish episode in January with a soaring 200DMA breakout. CAT looked set to provide a profitable place to “hide” from the crashes and accidents in tech. The respite was brief and a 5.2% post-earnings loss brought CAT right back to the bottom its recent trading range. There was a time when I would buy put options on CAT around here as a (partial) hedge against bullishness. However, such hedges have worked much better on the parts of the market going through persistent crashes and accidents.
Caterpillar, Inc (CAT) is scraping away at the bottom edges of its current trading range.
ARK Innovation ETF (ARKK)
The ARK funds have occupied the epicenter of crashes and accidents since their collective peaks a year ago. As such, these funds have provided the right place for hedging. All but one ARK fund is closing in on a complete reversal of pandemic era gains. These funds are the ultimate symbol of what worked so well during the pandemic and what is now completely wrong. The ARK Innovation ETF (ARK) closed the week at a 20-month low. Another 6.7% loss will take ARKK right to the point of a complete reversal. At some point, ARK’s leader Cathie Wood will be right about these funds representing “deep value.” However, I see no need to fight the trend. Instead, my adage “do not argue with sellers and celebrate with buyers” holds quite well with ARK. ARKK may not even represent a buy until it manages a fresh 50DMA breakout.
ARK Innovation ETF (ARKK) lost 5.0% and dropped to a 20-month low. Like all but one ARK fund, ARKK is just a few points away from its pre-pandemic high.
iShares MSCI Brazil ETF (EWZ)
In September, the iShares MSCI Brazil ETF (EWZ) triggered my buying rule on a 20% correction. I added one more tranche as EWZ rebounded from a test of the November, 2020 lows. Last month, I pointed out how EWZ is benefiting from a rebound in the price of iron ore. With EWZ back to the price of my first tranche and a small stall under 200DMA resistance (the blue line below), I decided to take profits on the trade. A confirmed 200DMA breakout might pull me back in depending on the general market context.
The iShares MSCI Brazil ETF (EWZ) stalled just under 200DMA resistance. This flagged a moment for profit-taking even as the 2022 lows look like a bottom for this cycle.
Stock Chart Reviews – Above the 50DMA
SPDR S&P Metals & Mining ETF (XME)
I bought the SPDR S&P Metals & Mining ETF (XME) last month as a play off the bottom of the trading range. Subsequently, I was too quick to take profits at converged 50 and 200DMA resistance. My bullishness on commodities should have kept me in. Now, XME is in a bullish position with a breakout above the trading range. I am looking to get back in on a test of the previous all-time high as support. A drop back into the trading range would be an opportunity to stop out of such a position.
It is hard to find parabolic moves in this heavy market. International shipping company Grindrod Holdings, Inc (GRIN) provided some rare fireworks with a parabolic 19.4% post-earnings gains. The gap down and 10.3% pullback the very next day confirmed once again the dangers of parabolic price action. If GRIN stabilizes from here and creates a base, I might consider a (speculative) buy. GRIN is profitable and revenues have soared recently.
Grindrod Holdings, Inc (GRIN) pulled back 10.3% after a parabolic post-earnings 19.4% gain. GRIN is one more example of the dangers of chasing parabolic moves.
*Charting notes: Stock prices are not adjusted for dividends. Candlestick charts use hollow bodies: open candles indicate a close higher than the open, filled candles indicate an open higher than the close.
Trading with on-going headline risk is difficult for bulls and bears. I find it useful to pick a narrative, pick an anchor, and stay as disciplined as possible. My foundation remains with the principles of trading contrary to extremes. Last week, the market tested the extremes of oversold trading conditions and survived surprisingly quickly. However, the drama (and tragedy) is far from over. At the time of writing, U.S. stock market futures are down over 2% on the latest war headlines (although currency markets are showing little of the strain outside of the Russian ruble which dropped as much as 30% under the weight of economic sanctions, see “Watch Currencies, Not Stocks, As Geo-Political Tensions Continue to Rise” for more details). The renewed weakness threatens to take the major indices right back to the bottom of the churn zones…and possibly worse. Since I reset some oversold trades on Friday, I will wait out the latest bout of volatility until/unless fresh oversold conditions occur. In the meantime, I will brace myself as I have committed to minimal hedging for now. The charts below are snapshots of survival that could change all over again…with some fresh buying opportunities ahead.
Stock Chart Reviews – Below the 50-day moving average (DMA)
Apple Inc (AAPL)
As the stock market hit oversold levels, Apple (AAPL) perfectly tested support at its 200-day moving average (DMA) (the blue line below). That rebound alone is the most encouraging thing to see from this latest oversold cycle. AAPL finished that day with a 1.6% gain. Despite already printing a 6.6% turnaround from the lows, buyers still had enough strength to tack on another 1.3% on Friday.
Apple Inc (AAPL) perfectly tested 200DMA support at the depths of oversold trading. The 1.3% follow-up gain confirmed a successful test.
Snap, Inc (SNAP)
Snap, Inc (SNAP) dropped 23.6% in sympathy with Meta Platform’s (FB) post-earnings collapse. The very next day, SNAP recovered those losses and more with a 58.8% post-earnings gain. Amazingly, SNAP is still holding on to those gains despite the on-going turmoil in the stock market. Meanwhile, SNAP has hugged its downtrending 50DMA (the red line below). The stock is one 50DMA breakout away from ending the downtrend and next establishing a run-up to 200DMA resistance.
Snap Inc (SNAP) continues to hold on to its 58.8% post-earnings gain despite struggling to print a 50DMA breakout.
Carvana Co (CVNA)
Online used car dealer Caravana Co (CVNA) was down as much as 69.3% from the all-time high it set last August. Sellers have largely been in control ever since. However, CVNA ended the week with a massive 21.0% post-earnings gain. This kind of move can turn around sentiment enough to carve out a sustainable bottom. I am watching how the stock responds to a test of overhead 50DMA resistance and/or the year’s closing low. That low briefly broke below CVNA’s pre-pandemic high and set a 20-month low.
Carvana Co (CVNA) surged 21.0% post-earnings and returned to its previous area of churn.
monday.comLtd (MNDY)
I featured work management software company monday.com Ltd (MNDY) in my piece titled “Snapshots of A Disappointing Start to the New Year“. MNDY sold off more from there. A rebound sent MNDY back to those prices but 50DMA resistance proved too much. MNDY plunged its way into earnings for an all-time low. A 14.0% post-earnings response makes me a little more interested even if the stock market’s oversold conditions helped fuel buying interest. Still, MNDY trades at 21.6 times sales. Sky-high valuations are particularly unattractive in a high-risk trading environment.
monday.com (MNDY) is using the oversold bounce to start recovering from a 27.6% post-earnings loss.
Home Depot, Inc (HD)
Home Depot (HD) surprised me with an 8.9% post-earnings loss. Sellers confirmed the 200DMA breakdown the next day. HD’s rebound with the stock market’s oversold bounce looks tepid. The stock looks like it could easily return to last week’s intraday low.
Home Depot, Inc (HD) confirmed a 200DMA breakdown with an 8.9% post-earnings loss. The bounce from oversold conditions only took HD back to that day’s close.
John Bean Technologies (JBT)
Chicago-based John Bean Technologies Corporation (JBT) “provides technology solutions to [the] food and beverage industry and equipment and services to air transportation industries.” JBT fell 19.4% post-earnings last week and caught my attention. That plunge took JBT below is pre-pandemic high and wiped out the rest of its gains for 2021. I quickly scanned the earnings results for clues on what upset investors. I noticed at least three main issues: 1) revenue and EPS misses from earlier guidance, 2) lower EBITDA year-over-year, and 3) a reference to higher corporate costs from a digital investment strategy and higher labor costs. Yet, trading at 1.9 times sales and 24x forward earnings, I am eyeing JBT as a “comeback” buy after some kind of stabilization around recent lows.
John Bean Technologies (JBT) gained 6.1% on the day as the stock starts a recovery from a 19.4% post-earnings sell-off.
Etsy, Inc (ETSY)
Etsy, Inc (ETSY) tumbled into earnings with a 17-month low. The stock market’s bounce from oversold conditions helped ETSY with a 10.0% pre-earnings surge. Buyers confirmed the change in control with a 16.2% post-earnings follow-on surge. While ETSY may churn from here, a sustainable bottom seems in place.
Etsy, Inc (ETSY) surged 16.2% post-earnings and confirmed a bottoming pattern by closing (marginally) above its prior peak.
ETFMG Price CyberSecurity ETF (HACK)
As war tensions continue to escalate over Ukraine, cybersecurity looms larger and larger. With the stakes so high between nuclear superpowers, cyber weapons might become the destructive tool of choice to avoid massive loss of life. The ETFMG Price CyberSecurity ETF (HACK) tested a 14-month low during oversold trading conditions. I should have reflexively bought HACK right at that point. Instead, I am looking to buy into the next dip.
ETFMG Price CyberSecurity ETF (HACK) dropped to a near 15-month low before rebounding to a 6.0% gain. A 1.6% gain the following day confirmed the bottom.
Intuit Inc (INTU) gapped and crapped after its August earnings but proceeded to meander higher from there. INTU was not so fortunate after November’s post-earnings gap and crap. INTU now trades 29.6% off that post-earnings and all-time high. At least INTU “survived” earnings and seems ready to hold the lows.
Intuit Inc. (INTU) topped out following November earnings. So far, the stock is holding steady after February earnings with tax day looming for most Americans.
OptimizeRx Corporation (OPRX)
OptimizeRx Corporation (OPRX) offers digital communication solutions in the health care industry. OPRX trades 61.5% off its all-time high but remains miles ahead of the single digit pricing from the March, 2020 stock market collapse. With valuation coming down, now 12.7 times sales and 59.9 times earnings, I have OPRX on my radar as an innovator in health care that looks like it has staying power. OPRX gained 5.2% post-earnings.
OptimizeRx Corporation (OPRX) gained 5.2% post-earnings. OPRX is a 50DMA breakout away from shifting to a more bullish posture.
Block, Inc (SQ)
Block, Inc (SQ) pulled off a stunning turnaround with a 26.1% post-earnings surge. While overhead resistance from a declining 50DMA may keep a lid on SQ for now, the record buying volume may have earned SQ a sustainable bottom. Time for me to look to buy the dips.
Block, Inc (SQ) surged 26.1% post-earnings. Clearing the prior area of churn puts SQ in a good position to create a sustained bottom.
Caterpillar, Inc (CAT)
Caterpillar (CAT) dropped into and stayed in bearish territory last week. CAT breached support from the second half of 2021. The stock finished erasing all of 2021’s gains at last week’s low.
Caterpillar, Inc (CAT) broke down below key support at the 2021 lows. Now CAT faces important resistance from this same technical level.
Stock Chart Reviews – Above the 50DMA
SPDR S&P Metals & Mining ETF (XME)
I got the dip I hoped for in the SPDR S&P Metals & Mining ETF (XME) and bought in. I strongly resisted the urge to take opportunistic profits after Friday’s 5.7% surge to a fresh all-time high. Gulp.
The SPDR Gold Trust (GLD) gapped higher when the stock market gapped lower on Thursday. As buyers took over the trading action in stocks, commodities traders clearly dumped gold along the way. The reversal was sharp enough to create a bearish engulfing pattern right after GLD perfectly touched the 2021 high set in January. This move looks like a kind of blow-off top, so I doubt GLD has much more upside from here for a while. I continue to hold a core long-term GLD position. I have not traded around that position in a long time (maybe since 2020?).
SPDR Gold Trust (GLD) reversed a 2.4% gap up into a bearish engulfing 0.7% loss. The surge stopped cold right at the 2021 high.
Lantheus Holdings, Inc. (LNTH)
It is hard to find parabolic moves in this heavy market. In the previous week, I found international shipping company Grindrod Holdings, Inc (GRIN). Last week it was Lantheus Holdings, Inc (LNTH) which “develops, manufactures, and commercializes diagnostic and therapeutic agents and products that assist clinicians in the diagnosis and treatment of heart, cancer, and other diseases worldwide” (Yahoo Finance). LNTH surged 39.1% post-earnings and followed that performance with a 16.1% gain. I am of course not chasing this parabolic move, but I am watching to see how the stock stabilizes after this overheating comes to an end.
Lantheus Holdings, Inc. (LNTH)followed a 39.1% post-earnings surge with a 16.1% gain. LNTH is in parabolic territory.
Alteryx, Inc (AYX)
In August, 2020, I said of Alteryx, Inc (AYX) “in a more ‘normal’ market, AYX would and should trade a LOT lower. Traders cut AYX in half since then. The stock made an attempt at carving out a sustainable bottom with an 11.8% post-earnings gain. Last week’s selling closed the gap, but buyers defended AYX from there. With a 50DMA breakout, AYX is a higher close from confirming a bottom. AYX also now trades at a more reasonable 7.7 times sales.
Alteryx, Inc (AYX) survived a complete fade of its post-earnings earnings to print a fresh 50DMA breakout. AYX is a close higher away from a bullish breakout.
Teucrium Corn Fund (CORN)
Traders learn the dangers of parabolic moves over and over. The Teucrium Corn Fund (CORN) gapped almost to $26 on Thursday before profit-takers rushed in. I was one of them. I just bought the breakout the previous day and expected the steady rally to continue. Convinced of the dangers of parabolic moves, I did not want to hold CORN another hot minute. Moreover, the commodity corn raced right into the daily price maximum. When CORN fell 4.6% on Friday, I could not resist buying right back in. I expect CORN to go back to its more steady trading from here. I have been eyeing CORN since last August when I hatched the plan to buy a breakout. At the time I did not think my return to CORN would involve quick flips of the shares.
Teucrium Corn Fund (CORN) gapped down and lost 4.5% following a parabolic surge.
*Charting notes: Stock prices are not adjusted for dividends. Candlestick charts use hollow bodies: open candles indicate a close higher than the open, filled candles indicate an open higher than the close.
Russia’s invasion of Ukraine has created massive human misery and a historic press of global economic sanctions. With war comes scarcity and the allocation of resources to destroying the resources of others. Financial markets are scrambling to adjust to the new global wartime economy. These charts are just a snapshot of some of the on-going direct impacts and the indirect impacts of increasing selling pressures throughout the stock market. There are numerous stocks stuck in bear market trading patterns as sellers tighten resistance looming over the trading action. At the same time, the global wartime economy is sending a select group of stocks soaring through uptrends.
Stock Chart Reviews – Below the 50-day moving average (DMA)
KraneShares Global Carbon Strategy (KRBN)
I may have stumbled upon KraneShares Global Carbon Strategy ETF (KRBN) right at an important top. Per plan, I bought a first tranche at the dip to support at the 50-day moving average (DMA) (the red line below). An eventual pop above the 20DMA (the dotted line below) made me think KRBN was on its way to continuing its uptrending behavior. It never occurred to me that the wartime economy in Europe might impact KRBN. According to ETF Trends:
“The EU Allowances (EUA) market has been particularly volatile, with some investors choosing to sit out any current price action on the sidelines, and technical levels being triggered and causing further sell-off.”
The European carbon market has a significant representation in KRBN.
With a major breakdown below the 200DMA (the blue line), I am in no rush to add to my holdings. One analyst in the article thinks nothing fundamental has changed in the European carbon market. However, I noted that Poland has raised persistent complaints about speculators driving up prices. So I prefer to wait to see how the dust settles. Moreover, the euro is selling off sharply against the U.S. dollar.
KraneShares Global Carbon Strategy (KRBN) fell apart last week as the the EU Allowances (EUA) market succumbed to market pressures in Europe.
Snap, Inc (SNAP)
The post-earnings rebound looked promising for Snap, Inc (SNAP). Unfortunately, 50DMA resistance proved too stiff. SNAP sold off 4 days straight and delivered a stronger confirmation of resistance. The stock is now pushing into its post-earnings gap.
Snap Inc (SNAP) finally started a reversal of its 58.8% post-earnings gains with the latest failure at 50DMA resistance. SNAP ended the week with a 7.2% loss.
Carvana Co (CVNA)
I have duly noted growing signs of bear market trading action in the wake of post-earnings reactions. Carvana Co (CVNA) looked impressive after a 21.0% post-earnings jump seemed to confirm the bullish engulfing bottoming pattern from the previous day. Instead, the downtrending 20DMA started to exert its gravitational force. Sellers took over and sold CVNA 5 days straight into a fresh 20-month low. This is bear market trading in full relief: a large rally from a positive catalyst followed by a sharp reversal. Think of relieved investors using the opportunity to drive off with the cash they can salvage while they still have a chance.
Carvana Co (CVNA) not only reversed a 21.0% post-earnings gain but also it closed the week at a fresh 20-month low. CVNA also closed below its pre-pandemic high.
Foot Locker, Inc (FL)
Last December, I expressed relief that I avoided the temptation to bottom-fish in Foot Locker, Inc (FL). That wariness bore more fruit after February earnings. FL lost 29.8% in the wake of earnings and now trades at a near 19-month low.
Foot Locker, Inc (FL) lost 29.8% post-earnings and is fighting to stabilize at these lower levels.
GoodRx Holdings, Inc (GDRX)
I wish I had been more wary about GDRX. The 2022 sell-off in GoodRx Holdings, Inc (GDRX) gave me an opportunity to rebuild a position. I made the case for GoodRx in December, 2020. The stock has only been worth a trade since then. This time, my trade finally failed. A 38.9% post-earnings drop was not even on my radar as a potential risk. A $250M stock buyback failed to mollify investors, but the news makes me hold out hope. I might even add more shares on a post-earnings closing high. In the meantime, analysts rushed to downgrade GDRX primarily because of apparent competitive pressures.
GoodRx Holdings, Inc (GDRX) lost 38.9% post-earnings despite the announcement of a stock buyback. GDRX now trades around all-time lows.
Etsy, Inc (ETSY)
Breakouts above 50DMAs are hard to come by. Etsy, Inc (ETSY) joined the list of stocks stopping cold at their 50DMA resistance. A test of now uptrending 20DMA support seems likely now.
The post-earnings rally for Etsy, Inc (ETSY) stopped cold at 50DMA resistance.
Renaissance IPO ETF (IPO)
I got a little trigger happy on Renaissance IPO ETF (IPO) on Thursday. I was looking for something on the speculative side to ride a potential rebound from Thursday’s selling. IPO is full of former high-flyers and collapsing growth stocks and can benefit greatly from relief rallies. However, there was nothing in the technicals that indicated a bottoming process. Now, IPO trades at a new 20+ month low, and I find myself thinking about where to draw a line in the sand for a stop. I should have had a stop in mind before making the trade!
The Renaissance ETF (IPO) sold off heavily the last two days of the week and finished at a new 20+ month low.
MongoDB, Inc (MDB)
Cloud database company MongoDB, Inc (MDB) dropped heavily in the last two days of the week: first a 14.3% loss and then a 6.5% loss. The dust settled on a 9-month low for the week. The messy chart looks clearer with a double-top late last year and a lower top at 50DMA resistance last month.
MongoDB, Inc (MDB) sold off for two straight days and hit a 9-month low. Last fall’s topping pattern received a fresh confirmation.
Peloton Interactive, Inc (PTON)
Like CVNA, Peloton Interactive, Inc (PTON) displayed typical bear market trading. PTON viciously gapped up off its lows with a 20.9% gain. Earnings that evening produced a 25.3% gain the next day. PTON even confirmed a 50DMA breakout. Yet, all this impressive buying force was not enough. With buyers exhausted, sellers gradually picked away at the gains. Nearly non-stop selling closed PTON out at prices last seen just days after the bottom of the stock market collapse in March, 2020.
Peloton Interactive, Inc (PTON) is what bear market trading action looks like. PTON failed to hold a 20.9% gap up from the bottom followed by a 25.3% post-earnings gain.
Block, Inc (SQ)
Like ETSY, fintech company Block, Inc (SQ) found stiff resistance at its 50DMA. SQ is now pushing into the gap created by the 26.1% post-earnings gain in late February. Bear market trading is flashing its teeth here.
Block, Inc (SQ) dimmed the prospects of a sustainable bottom by failing in picture-perfect form at 50DMA resistance. Four straight days of selling have pushed SQ into its post-earnings gap up.
Stock Chart Reviews – Above the 50DMA
Maxar Technologies Inc (MAXR)
Maxar Technologies (MAXR) quickly disappointed me after I followed an analyst upgrade that made the technicals look sound. Good news finally arrived with an impressive reversal from a 9.4% post-earnings loss. MAXR even pulled off a confirmed 200DMA breakout last week. Maxar’s earth intelligence and space infrastructure solutions should prove useful in the new global wartime economy. However, I am still wary that bear market trading could bring MAXR right back down to earth.
Maxar Technologies Inc (MAXR) confirmed a bullish 200DMA breakout but ended the week with two days of selling.
SPDR S&P Metals & Mining ETF (XME)
For a second time, I got too eager to take profits in SPDR S&P Metals & Mining ETF (XME). A fade on Tuesday made me think a blow-off top was in the works. Rather than wait for confirmation, I locked in my profits. Buyers have eagerly stepped in ever since. With hindsight, I have a greater appreciation of the value of metals and mining in the global wartime economy. Russia and Ukraine control large chunks of global commodities. XME includes the stocks of steel companies which should prove strategically important in the global wartime economy.
SPDR S&P Metals & Mining ETF (XME) continues to appreciate in rapid fashion. The rally through all-time highs remains orderly and not yet parabolic.
SPDR Gold Trust (GLD)
It is time for me to trade around my core position in the SPDR Gold Trust (GLD). GLD made an impressive recovery from a bearish engulfing pattern from the prior week. With financial markets at the center of economic warfare, gold looks like a safe haven all over again. Contrast this with the recent tepid trading in cryptocurrencies despite strong use cases emerging in the global wartime economy like direct donations to the Ukrainian government.
SPDR Gold Trust (GLD) quickly overcame a bearish engulfing topping pattern and closed last week at an 18-month high.
iShares GSCI Commodity Dynamic Roll Strategy ETF (COMT)
Several broad commodity indices exist. I recently got interested in the iShares GSCI Commodity Dynamic Roll Strategy ETF (COMT). COMT is a way to get exposure to commodities futures. I missed the 200DMa breakout and recovery from a gap and crap soon after. My experience with KRBN has me more circumspect than usual about the persistent strength since December. COMT is running hot and parabolic, so I am definitely not touching it here. Soaring oil prices are helping to propel COMT to the stratosphere. I am looking for some kind of dip to buy in the global wartime economy.
(Note the large gap down in December came from a dividend payment).
The iShares GSCI Commodity Dynamic Roll Strategy ETF (COMT) tells the broad story about commodities in what has become a global wartime economy. COMT gained 18.6% for the week and trades at an all-time high.
iShares Global Clean Energy ETF (ICLN)
With the global wartime economy placing various pressures on carbon-based fuels, clean energy plays have received a fresh look. I have my eyes on the iShares Global Clean Energy ETF (ICLN). ICLN includes a smattering of speculative names as well as well-established companies. The ETF broke out on Monday with a 6.5% gain. Sellers took over from there all the way back to 50DMA support. I am waiting to buy on a bounce from this support level.
The iShares Global Clean Energy ETF (ICLN) started the week with a 6.5% breakout above its 50DMA. Sellers took over from there and forced the issue of a test of 50DMA support.
iShares U.S. Aerospace & Defense ETF (ITA)
The iShares U.S. Aerospace & Defense ETF (ITA) is dominated by two large holdings: defense contractor Raytheon Technologies Corporation (RTX) at 22.7% and Boeing (BA) at 17.2%. The aerospace components of ITA are acting like a drag. Otherwise, the prospects for the global wartime economy have given ITA a fresh boost with a breakout close to all-time highs.
The iShares U.S. Aeropsace & Defense ETF (ITA) is weighed down by some of its aerospace components, but last week’s breakout signals a fresh spark from the coming global wartime economy.
Teucrium Corn Fund (CORN)
World food prices are at all-time highs. The Food and Agriculture Organization (FAO) of the United Nations reported record food prices for February. From the report:
“The FAO Food Price Index averaged 140.7 points in February, up 3.9 percent from January, 20.7 percent above its level a year earlier, and 3.1 points higher than reached in February 2011. The Index tracks monthly changes in the international prices of commonly-traded food commodities.”
The comparison to February, 2011 is an important confirmation that food prices are not relatively high because of base effects from any pandemic-related declines. Indeed food prices were higher than 2019 going into the pandemic and ended 2020 at the highs. The year-over-year price comparisons since then are quite dramatic. The global wartime economy promises to continue exacerbating these price imbalances.
Corn prices are participating in the soaring price levels with two parabolic moves in the Teucrium Corn Fund (CORN) since the global wartime economy erupted. I sold my second round of CORN on the immediate recovery from the first pullback from parabolic price levels. I doubt I will participate again anytime soon. Recall that I avoid parabolic price action whether short or long: the risk of loss is tremendous from poorly timing shorts and going long requires nimble timing to get out of the way of the near inevitable pullback.
Teucrium Corn Fund (CORN) resumed parabolic behavior until sellers faded Friday’s highs. Corn still ended the day with a 2.4% gain.
*Charting notes: Stock prices are not adjusted for dividends. Candlestick charts use hollow bodies: open candles indicate a close higher than the open, filled candles indicate an open higher than the close.
Last week delivered a series of confirmed breakouts that served to uphold bullish belief in the stock market. Even as the overall rally looks to continue, the market’s most troubled corners showed weakness at the end of the week. These holdouts failed to break through important resistance levels. Some of these growth stocks even suffered significant pullbacks on Friday. I will be watching to see whether any renewed dichotomy wears on important measures of market breadth.
Stock Chart Reviews – Below the 50-day moving average (DMA)
Coupa Software Incorporated (COUP)
Supply software company Coupa Software Incorporated (COUP) is one of the holdouts. COUP’s impressive post-earnings recovery stalled right at its downtrending 20-day moving average (DMA) (the dotted line below). A breakout puts the 50DMA (the red line below) into play. Follow-through selling puts the entire rebound at risk.
Coupa Software Incorporated (COUP) stalled out at 20DMA resistance after an impressive rebound from post-earnings lows.
monday.com Ltd (MNDY)
The stock for work management software company monday.com Ltd (MNDY) was an even bigger holdout last week. Not only did MNDY’s sharp rebound come to a screeching halt at 50DMA resistance, but also MNDY dropped 10.8% into a test of 20DMA support. At best, I expect MNDY to churn in this range.
monday.com Ltd (MNDY) ran into stiff resistance at its 50DMA. MNDY even lost 10.8% at the end of the week.
Unity Software (U)
Interactive and real-time 2D and 3D content creation platform company Unity Software (U) also slammed into stiff resistance at its 50DMA. The stock lost 5.8% on Friday. U is in limbo until it breaks out of the tight range between 20 and 50DMAs.
Unity Software Inc (U) ran into stiff resistance at its 50DMA. U lost 5.8% at the end of the week.
Poshmark, Inc (POSH)
Poshmark, Inc (POSH) came to the market with a lot of IPO hype. After a splashy opening day, POSH has mainly tumbled downhill. POSH tumbled below its $42 upsized IPO price within two months. As with many busted IPOs, the IPO price served as a pivot point for a time. POSH gave up the ghost after another 4 months and never looked back. This holdout stock still faces significant downward pressure. While POSH recovered from a post-earnings gap down and closed the day with a 2.5% gain, buyers lacked enough enthusiasm to push the stock through 50DMA resistance.
Online clothing reseller Poshmark closes up more than 140% on first day of trading https://t.co/EhUPQrOFsC
Poshmark, Inc (POSH) has yet to break through the downtrend defined by its 20 and 50DMAs. This downtrend extends back to POSH’s second day of trading.
Stock Chart Reviews – Above the 50DMA
Juniper Networks (JNPR)
Juniper Networks (JNPR) popped back into my radar after a long, and unfortunate, hiatus. JNPR is relishing in bullish belief with an impressive breakout to a near 11-year high. While JNPR followed the market’s pressure in January, earnings delivered a convincing recovery. JNPR is a buy on the dips from here for me.
Juniper Networks (JNPR) broke out to a near 11-year high as post-earnings momentum resumes.
Apple Inc (AAPL)
I have to rub my eyes every time I look at the stock chart for Apple Inc (AAPL). Buyers have rushed back into this market leader with a non-stop ferocity. Nine straight days of gains has AAPL challenging its February highs. Continued momentum from here should lead to an eventual all-time high.
Apple Inc (AAPL) looks ready to crack its twin February highs. Buyers have yet to rest since pulling AAPL from its 200DMA breakdown. Even the confirmed 50DMA breakout is in the rear view mirror.
Alphabet Inc (GOOG)
Alphabet announced a 20-1 stock split as a part of its earnings statement on February 1st. That news helped GOOG surge 7.4% that just missed setting a new closing all-time high. The stock market’s pressures made traders and investor quickly forget about the (artificial) boost from the stock split news. However, GOOG impressively held the December lows as support three separate times. This rare quadruple bottom provided the fuel for last week’s confirmed 200DMA breakout (the blue line below). GOOG is now positioned to make a fresh run at all-time highs.
Alphabet Inc (GOOG) pulled off the rare quadruple bottom on the way to its rebound. Last week’s confirmed 200DMA breakout puts GOOG back into a bullish mode.
Microsoft Corp (MSFT)
Microsoft (MSFT) is a relative laggard to the big cap tech leaders. MSFT barely confirmed a 50DMA breakout last week and is now struggling to break free of a 200DMA pivot. The stock also has a long way to travel to return to all-time highs. The triple top from November to December could prove tough to crack for a while.
Microsoft Corp (MSFT) confirmed its 50DMA breakout but is struggling to break away from its 200DMA. MSFT is one gain away from confirming a fresh bullish phase.
Amazon.com, Inc (AMZN)
Amazon.com, Inc (AMZN) returned to the middle of its long-term trading range. Incredibly, AMZN has churned to nowhere for almost two years now. Whenever AMZN finally breaks out, I hope I am ready to ride the rocket ship higher. For now, AMZN is stuck churning under 200DMA resistance.
Amazon.com, Inc (AMZN) easily cleared its 50DMA resistance. However, AMZN churned all week just below 200DMA resistance. AMZN is right back in the middle of a trading range that started almost 2 years ago.
Tesla, Inc (TSLA)
Tesla, Inc (TSLA) made it. There is perhaps nothing as bullish as seeing TSLA in a bullish position created by a major breakout. TSLA’s strength gives “permission” for trading other popularly speculative names. Even a pullback from here should meet firm support from a converging trifecta of the 20, 50, and 200DMAs.
Tesla, Inc (TSLA) confirmed its 50DMA breakout last week and is back in bullish mode. TSLA gained 11.6% just last week.
FIGS, Inc (FIGS)
FIGS, Inc (FIGS) also made it. FIGS confirmed a 50DMA breakout last week. I am a little wary just because of the false moves from last year. Still this is an encouraging move for one of my favorite “clothing” stocks. I continue to enjoy wearing scrubs as comfort gear around the house. The extra pockets work great for the quick jaunts out the house.
FIGS, Inc (FIGS) confirmed its 50DMA breakout last week. Now FIGS needs to beat out previous 50DMA breakouts in duration.
Anaplan, Inc (PLAN)
Thoma Bravo scooped up yet another software company out of the public markets. I am not sure what this M&A shop does with its growing trophy collection, but the pricing of its deals provide clues for how to value the rest of the growth software universe. Thomas Bravo took out Anaplan, Inc (PLAN) at a 16x price/sales valuation. Assuming PLAN’s acquiescence to the deal demonstrates fair value (and probably a premium to fair value), I know that I generally want to avoid paying more than 16x sales for similar companies. In a market with increasing rates, I likely want to wait on discounts to fair value as low as 12x sales and lower.
Anaplan, Inc (PLAN) gained a healthy 27.7% on the buyout offer from Thoma Bravo. However, the stock fell far short of its all-time high. The resulting 16x sales valuation sets a target premium for other growth software companies.
ZipRecruiter, Inc (ZIP)
In a tightly constrained labor market, I would expect services like ZipRecruiter, Inc (ZIP) to soar. Then again, with the a limited labor pool, the likes of ZIP could also be facing a shortfall in the kind of supply that keeps the gears turning. Valued at just 3.6x sales, ZIP has my attention with last week’s confirmed 50DMA breakout.
ZipRecruiter, Inc (ZIP) confirmed a 50DMA breakout last week but stalled out the last 3 days of trading.
CSX Corporation (CSX)
I recently listened to a great podcast called “Invest Like the Best” with host Patrick O’Shaughnessy. On March 1st, he aired an interview with Eric Mandelblatt called “Investing in the Industrial Economy.” It reminded me of my deep interest in commodities roughly 10 years ago. I left convinced I need to pay a lot more attention going forward. I love investing in the industrial economy over the tech economy because the cycles make more sense, valuations are easier to comprehend, and, best of all, the physical nature of the economy is palpable in a way that the economy of speculative growth stocks often lacks.
Of the companies Madelblatt offered, CSX Corporation (CSX) really stood out. CSX is highly levered to a lot of the big trends coming in the industrial economy with the added benefit of facing minimal competition and the limited supply of rail lines. I will soon pile into CSX for the long-term. The company is currently at the higher end of its valuation metrics, so I will have to be patient.
Madelblatt called out Goldman Sachs’s Jeff Currie as one of the best commodity forecasters around. The video below contains themes Madelblatt has adopted.
CSX Corporation (CSX) bounced convincingly off its 200DMA support and is trading near all-time highs again.
*Charting notes: Stock prices are not adjusted for dividends. Candlestick charts use hollow bodies: open candles indicate a close higher than the open, filled candles indicate an open higher than the close.
After much resistance to Fed hawkishness, the U.S. stock market gave way to fresh bearishness. The major indices dropped into new depths of the bear den. The stocks below are snapshots of the latest deterioration in the price action and decline in the technical health underlying the stock market. The ARK funds are a part of this fascinating chart study because they share a common pattern that delivers strong signals about the market’s risk attitudes. Fresh bearishness drives risk attitudes lower and lower.
Stock Chart Reviews – Below the 50-day moving average (DMA)
ARK Innovation ETF (ARKK)
It was a big deal when the ARK Innovation Fund (ARKK) first lost all its pandemic-era gains. The moment coincided with Russia’s invasion of Ukraine, and the algorithms went into automatic contrarian mode. Buyers stepped in and sent ARKK rallying sharply alongside a host of beaten-up speculative names. The ARKK rally stopped cold at resistance at the 20-day moving average (DMA) (the dotted line below). The next breach of the pre-pandemic high sent ARKK down to a 23-month low. The oversold bounce from there created a temporary breakout above 50DMA (red line below) resistance. The latest breach is testing the March low. If past patterns persist, ARK will eventually go lower from here. Regardless, the next bounce faces stiffer resistance at the pre-pandemic high.
The ARK Innovation ETF (ARKK) is testing its March lows. Whatever bounce comes next, the pre-pandemic high now looms as ominous resistance.
ARK Fintech Innovation ETF (ARKF)
The price patterns of the ARK innovation funds all look the same. The ARK Fintech Innovation ETF (ARKF) is practically a carbon copy of ARKK. As a result of the lack of a diversification effect, spreading bets across ARK makes little sense. ARKF finished the week taking a baby step ahead of ARKK with a breach of the March low. Accordingly, the pandemic lows are now in play as the next test.
The ARK Fintech Innovation ETF (ARKF) slipped by its March closing low and officially put its pandemic low into play.
ARK Next Generation Internet ETF (ARKW)
The ARK Next Generation Internet ETF (ARKW) looks like ARKK and ARKF. ARKW has slightly better performance relative to the pre-pandemic high. ARKW has spent little time below this important threshold. ARKW has also not yet retested its March low.
The ARK Next Generation Internet ETF (ARKW) freshly broke through its pre-pandemic high. ARKW now trades just a point and a half from its March low.
ARK Genomic Revolution ETF (ARKG)
Perhaps ARK Genomic Revolution ETF (ARKG) is the most speculative of the ARK group. While ARKK, ARKF, and ARKW spent much of 2021 trying to stabilize after the climactic tops in January, 2021, ARKG maintained a slight downtrend. However, unlike the other three funds, ARKG has found support at its pre-pandemic high. I doubt support will hold for long on this second go-round.
The ARK Genomic Revolution ETF (ARKG) bounced perfectly off its pre-pandemic high last month. Can ARKG pull off this magic one more time?
Unity Software (U)
Interactive and real-time 2D and 3D content creation platform company Unity Software (U) enjoyed a brief breakout above 50DMA resistance earlier this month. In true bear market fashion, sellers took over after a 9.8% surge. Now, Unity Software is staring down a test of its March lows on the heels of fresh bearishness.
Unity Software Inc (U) has only experienced 2 up days since its false 50DMA breakout. U is a March low breakdown away from hitting all-time lows.
Robinhood Markets, Inc (HOOD)
Robinhood Markets, Inc (HOOD) delivered classic bear market action in the form of news about the availability of after hours trading. Nevermind such a feature is unlikely to add much revenue or even profits, traders initially sent HOOD soaring 24.2%. Sellers took over from there. A 50DMA breakout turned into a fresh 50DMA breakdown and new all-time low.
Robinhood Markets, Inc (HOOD) started the latest downtrend with a 24.2% surge through 50DMA resistance on news of after hours trading. HOOD closed the week at an all-time low.
Wix.com Ltd (WIX)
Bear market action for web publishing platform Wix.com Ltd (WIX) came from a brief 50DMA breakout earlier this month. The downtrend barely budged and WIX soon snapped back to the 50DMA. The stock reconfirmed its 50DMA breakdown and looks set to test its March lows.
Wix.com Ltd (WIX) is back to following its 50DMA downtrend to lower prices.
Lowes Companies, Inc (LOW)
Home improvement retailer Lowes Companies, Inc (LOW) hit a double top in December, 2021. LOW never looked back after its 50DMA breakdown despite a brief breakout in March. The 20DMA looks like the more salient downtrend now. LOW closed the week at an 8-month low.
Lowes Companies, Inc (LOW) lost 3.9% and closed at an 8-month low. The 20DMA reasserted a steep downtrend.
AGNC Investment Corp (AGNC)
I reluctantly took profits on mortgage-backed securities (MBS) company AGNC Investment Corp (AGNC) last July. AGNC was one of a select few stocks I stepped into and held from the March, 2020 collapse. Last summer, St. Louis Federal Reserve President spoke ahead of his peers in questioning the on-going purchases of MBSs with a record hot housing market. While it took quite some time for the Federal Reserve as a whole to get the point, I got the point right away. Now, AGNC trades at 2-year lows. While pandemic lows should be off the table, I see no end to the downside until the Fed’s process of policy normalization comes to an end.
AGNC Investment Corp (AGNC) has been under pressure ever since the June, 2021 50DMA breakdown. The downtrend accelerated again and closed AGNC at a 2-year low.
J.B. Hunt Transport Services, Inc (JBHT)
Last October, J.B. Hunt Transport Services, Inc (JBHT) helped signal an end to the bear cycle at that time. JBHT did not make much progress until a March breakout to a fresh all-time high. A little over a month later, JBHT joined the bearish chorus in the stock market with swift selling into 50DMA and 200DMA breakdowns. JBHT is trying to stabilize right under that October breakout. I expect more downside if the stock market weakens further.
J.B. Hunt Transport Services, Inc (JBHT) started April with a 200DMA breakdown. JBHT has spent the last 2 weeks trying to stabilize under the October, 2021 breakout point.
AMC Entertainment Holdings, Inc (AMC)
Bear market action showed up in AMC Entertainment Holdings, Inc (AMC) after a 44.9% surge failed to create a 200DMA breakout. The fade from 200DMA resistance opened the floodgates of profit-taking. Sellers rolled AMC back in just over a week. Now the stock is under its 50DMA again with the March lows in play. What caused all the excitement? Buyers jumped when the CEO announced he would “embark on more ‘transformational’ deals to capitalize on the interest of retail investors following its bet on a troubled gold and silver mine operator.” AMC’s periphery deals and businesses are flushing investor money down the toilet all in the name maintaining interest in the stock…and perhaps even distract from the reality that AMC’s core movie theater business is extremely over-valued even at these levels.
AMC Entertainment Holdings, Inc (AMC) failed perfectly at 200DMA resistance last month with a classic blow-off top. The current 50DMA breakdown puts the March low in play.
Jumia Technologies AG (JMIA)
This fresh bearishness struck close to home as I remain an avid long-term investor in Jumia Technologies AG (JMIA). JMIA jumped 24.7% on news of a partnership with UPS in Africa. This news sounded transformational. The move appeared to solidify a bottom in the stock. While that bottom remains intact, sellers reversed the UPS gains and took JMIA under its 50DMA. I knew better than to chase the stock higher, but I did add to my position on the pullback.
Jumia Technologies AG (JMIA) sucked in the last buyers with news of a partnership with UPS.
Netflix, Inc (NFLX)
This fresh bearishness contains a healthy heaping of irony. Netflix’s valuation frequently astounded me given the amount of money the company had to spend first to expand internationally and then to commit to a seemingly endless amount of content. In January, 2019, I even posted a related Saturday Night Live skit and wrote (emphasis new): “This fantastic Saturday Night Live (SNL) skit summarizes the longer-term bearish case on NFLX: too much spending on too much content for small/niche audiences.” NFLX traded at $298 at that time. The stock got close to $400 just ahead of the pandemic and then rode the pandemic tailwinds to a double-top just under $700 last November. NFLX closed last week at $215 as the bearish long-term case finally caught up.
Ironically, I finally nibbled on some NFLX shares after the PRIOR post-earnings blow-up. Even up 12%, I did not take profits. With the stock back to January, 2018 levels, I am considering nibbling some more soon. Absent some new catalyst that forces people to watch Netflix, I highly doubt NFLX will return to $700 in the next few years. However, the stock should offer periodically profitable rallies given the much more reasonable valuation: 19x forward and trailing earnings and 3x sales. The biggest wildcard will be just how long and how deep will subscriber losses run before stabilization arrives to save the day. Recent price increases will likely help convince marginal subscribers to bail on Netflix.
Netflix, Inc (NFLX) lost an historic 35.1% post-earnings and soured the mood in all related stocks. This weekly chart shows that NFLX is now reversing a breakout that started January, 2018!
fuboTV Inc (FUBO)
Some stocks are clear and obvious shorts. I put fuboTV Inc (FUBO) in that category in early 2021. However, high short interest and a stubborn meme stock fan base made it hard to bet on the long-term direction for FUBO. Fast forward to Netflix’s implosion, and the case for endless consumption of streaming has been laid bare. While NFLX benefited from boundless optimism until lat November, the top for FUBO came in early 2021 with a final topping extending from June to November. The plunge from there has been near relentless. FUBO now trades near a 3-year low with no end quite in sight yet.
The excitement that erupted for fuboTV Inc (FUBO) with high volume trading in late 2020 is long over. This weekly chart shows FUBO approaching a 3-year low.
Meta Platforms, Inc (FB)
The bullish case for Meta Platforms, Inc (FB) finally ended with a post-earnings collapse in February. After seeing the downward momentum, I assumed the pre-pandemic high would become stiff resistance. FB made a valiant attempt to break out above this threshold, including a 50DMA breakout, last month. However, the relief rally ended there. Fresh bearishness slid FB along its downtrending 50DMA. The latest NFLX debacle helped plunge FB off that line. NFLX’s news put the big cap tech complex into question so much so that an analyst downgrade helped punch FB down 7.8%:
“…a negative note from Cleveland Research, whose checks indicate that current-quarter business has tanked. The firm has apparently cut its estimates well below street consensus, based on a slowdown in everything from its e-commerce efforts to a breakdown in its targeting to share loss to rivals. The first quarter looks weak, and April’s to-date business is slowing even more than that, the firm notes. Advertiser return on investment is weaker from inflation in CPM rates, a drop in conversion rates, and targeting changes – and nearly half of agencies are set to miss their ROI goal, Cleveland says.”
FB now trades at a near 2-year low.
The Meta Platforms (FB) company placard changed from the infinity symbol to the familiar thumbs up…at least for today. The additional basil leaf is a mystery to me.
Meta Platforms, Inc (FB) closed at a 2-year low. Amazingly, its pandemic lows are now in play.
Alphabet Inc (GOOG)
Alphabet Inc (GOOG) was one of the last big tech holdouts. GOOG was performing well enough to return to bullish positioning on a 200DMA breakout last month. The stock held its 2022 lows as support four times. Finally, the selling pressure of fresh bearishness became too much. Likely a rush to preserve profits took GOOG down enough the last two days to generate a significant breakdown to a 10-month low.
Alphabet Inc (GOOG) was one of the last holdouts. A 4.3% loss confirmed a major breakdown below 2022 support. GOOG now trades at a 10-month low.
Sea Limited (SE)
Singapore-based Sea Limited (SE) specializes in “digital entertainment, e-commerce, and digital financial service businesses” in various Asian and Latin American markets according to Yahoo Finance. SE enjoyed an incredible run in the pandemic era. Its lows in March, 2020 were not even a major new low. SE gained 608% from the point of recovering its losses from the crash to the final all-time high last November. The sell-off since then has been even more dramatic. SE has lost 76.1% since its all-time high. With a more reasonable valuation of 4.7x sales, I put SE on my buy list for the next bullish cycle in the stock market…whenever that happens. I missed the opportunity last month.
Sea Limited (SE) barely slipped by its March low and closed at a 23-month low. SE’s 50DMA downtrend has sent the stock to a 76.1% drop off its all-time high.
Zoom Video Communications, Inc (ZM)
Little new to say about the on-going correction in Zoom Video Communications, Inc (ZM). I was reminded of the competitive pressure on Zoom after doing another video call on Toucan with my buddies from grad school. A cousin also recently introduced me to free, open source jitsi which is a great tool for the consumer market. Jitsi also seems to be making some inroads in the enterprise market. In other words, video communications technology is quickly becoming commoditized as one would expect with the incredible popularity of connecting face-to-face. For some reason, Cathie Wood continues to believe that Zoom is an innovative disruptor. Wood’s team has consistently bought ZM on the way down and added yet more last week. ARKK and ARKW are top ETF holders of ZM shares.
At least ZM has a more reasonable valuation of 7.5x sales.
Zoom Video Communications, Inc (ZM) continues to be defined by its 50DMA downtrend. A test of the March lows is in play.
Shopify Inc (SHOP)
Wood also bought yet more Shopify (SHOP), the popular e-commerce platform, last week. Admittedly, at a 2-year low SHOP looks tempting. However, its price/sales ratio is still in the double digits at 12.7. Thus, I am content to wait. If SHOP conquers its pre-pandemic high before going even lower, I may have to nibble earlier than planned.
Shopify Inc (SHOP) left behind its pre-pandemic high and closed at a 2-year low. The pandemic lows are in play.
VanEck Semiconductor ETF (SMH)
Semiconductors provided one of the more surprising sources of fresh bearishness. The VanEck Semiconductor ETF (SMH) broke down to an 11-month low. SMH had a brief return to bullishness last month with a 200DMA breakout. Now, SMH looks on track for erasing the rest of its 2021 gains by dropping to $215.
VanEck Semiconductor ETF (SMH) showed a flash of potential for a challenge of 50DMA resistance. SMH ended the week at an 11-month low.
The Walt Disney Company (DIS)
I already own shares of The Walt Disney Company (DIS), and I want a lot more at current prices. The downtrend in DIS accelerated last week partially thanks to the NFLX debacle. This fresh bearishness took DIS to an 18-month low. I remain patient because DIS has yet to stabilize since it dropped out of 2021’s consolidation range. Moreover, DIS still has a forward P/E of 27, so it is not yet back to bargain territory on a valuation basis. For now, I just keep watching.
The Walt Disney Company (DIS) accelerated to the downside again thanks to NFLX. DIS closed the week at an 18-month low.
Corsair Gaming Inc (CRSR)
Corsair Gaming (CRSR) was a surprisingly hot IPO in late 2020. CRSR soaked up all the enthusiastic buyers in less than two months. Outside of a bizarre meme stock related surge in June, 2021, CRSR has fallen relatively consistently for over a year. Poor earnings guidance delivered fresh bearishness for CRSR. The stock sliced right through its 2022 lows and looks ready to return to the beginning right after the IPO.
Corsair Gaming, Inc (CRSR) lost 11.8% after guiding earnings down on weakness in Europe. CRSR is nearing its day one closing price.
Freeport-McMoRan, Inc (FCX)
Even commodities were not spared from the fresh bearishness. Copper producer Freeport McMoRan, Inc (FCX) fell 9.9% post-earnings. FCX confirmed the 50DMA breakdown with a 6.8% drop on Friday. With poor guidance and troubles at a Preuvian copper mine, I am in no rush to return to FCX. However a test of 2022 lows and/or a test of last Fall’s lows will likely get me off the sidelines. Physical commodities are the place to be in an inflationary environment. They should even do well after inflation cools and stable economic growth continues/resumes.
Freeport McMoRan, Inc (FCX) confirmed a 50DMA breakdown following earnings and troubles at a Peruvian copper mine.
Alcoa Corporation (AA)
Alcoa Corporation (AA) also disappointed commodities investors. AA lost a whopping 16.9% post-earnings. AA’s 50DMA breakdown was next confirmed by a 6.7% follow-up plunge on Friday. I am not as eager to buy AA given the competition with Chinese aluminum producers. I could get interested at 200DMA support.
Alcoa Corporation (AA) may be rolling over after a 16.9% post-earnings loss led to a confirmed 50DMA breakdown.
BHP Group Limited (BHP)
Diversified iron ore producer BHP Group Limited (BHP) is suddenly looking bearish. The two days of selling in commodities confirmed a failure at the triple top from 2021. Thus, I am not interested in rushing back to BHP. I might reconsider at the 200DMA. Below that, BHP could free fall to its lows from last Autumn…which would trigger immediate purchases from me.
BHP Group Limited (BHP) tumbled on high volume into a confirmed 50DMA breakdown. The failure to break through 2021’s triple top looks like a bearish setup.
Stock Chart Reviews – Above the 50DMA
lululemon atheltica inc (LULU)
Last week I thought lululemon atheltica inc (LULU) pulled off an amazing turnaround with a confirmed 200DMA breakout. However, fresh bearishness took LULU down as well. The dust settled on a confirmed 200DMA breakdown and a return to trading in the limbo land between the 50DMA and the 200DMA.
lululemon athletica inc (LULU) had a promising but brief visit in bullish territory above its 200DMA. The week-ending sell-off ended the breakout.
Teucrium Corn Fund ETV (CORN)
The pullback in commodities even hit Teucrium Corn Fund ETV (CORN). I cannot call this fresh bearishness as the strong uptrend remains intact. I missed the last breakout, but I am back to watching CORN closely for the next entry point. Note that Purdue University agricultural economists Michael Langemeier and James Minter advised corn farmers earlier this month that they had to consider making sales at these price levels. In other words, even farmers need to make sure to lock in some profits in a relentless bull market.
Teucrium Corn Fund ETV (CORN) peeled off its upper Bollinger Band for the first time this month. The 20DMA still defines a robust uptrend.
Caterpillar, Inc (CAT)
Caterpillar, Inc (CAT) was yet another surprise in this period of fresh bearishness. CAT was looking good with a breakout to a 10-month high before the selling struck. Profit-takers bumrushed to the tune of a 7.0% pullback on Friday. I could not find any news to explain the swift and sharp pullback.
Caterpillar, Inc (CAT) plunged 7.0% on no apparent news. CAT sharply ended a breakout to a 10-month high.
Tesla, Inc (TSLA)
In a week of fresh bearishness, Tesla, Inc (TSLA) stood out as a firm holdout. Although TSLA faded after its initial post-earnings pop, the stock held is ground on Friday. TSLA also remains above both its 50DMA and 200DMA. Both trend lines are still enjoying uptrends. If TSLA breaks down again from here, look out for the rest of the market, especially the ARK funds. I suspect it will take oversold conditions in the stock market to convince sellers to get serious in TSLA again.
Tesla, Inc (TSLA) remains one of the last ones left standing. However, repeated failures to break out are pressuring the stock. A post-earnings pop was quickly faded.
*Charting notes: Stock prices are not adjusted for dividends. Candlestick charts use hollow bodies: open candles indicate a close higher than the open, filled candles indicate an open higher than the close.
When Cathie Wood anticipated a “doozie of a correction” in early 2021, she surely did not expect a complete collapse in the mania and bubble she had enjoyed during the first year of the pandemic. However, the cash machine betting on the downtrend in the ARK Funds may finally stop operations soon. Last week, one of the ARK funds, ARK Fintech Innovation ETF (ARKF), became the first of the pre-pandemic group of ETFs to crash to all-time low levels. After printing that gut-wrenching milestone, ARKF promptly rebounded 5.3% the next day. Buyers followed through with a gap up and 12.4% surge. While that move aligned with the general stock market’s picture-perfect bear market bounce, ARKF’s milestone could still signal the emergence of sustainable bottoming levels.
With a downtrend still firmly in place, confirmation of a bottom will come from breaks through higher technical levels. This post examines the performance and levels of the six largest ARK funds in search of the so far elusive bottom.
So are we there yet? Well, despite the strong buying to end the week, ARKF still closed DOWN 6.2% for the week. Buyers have a LOT of work ahead to heal the leveling of one of the most well-recognized bubbles in the stock market.
The ARK Fintech Innovation ETF (ARKF) recovered from all-time low levels to close the week above the former all-time low.
The Performance Grid
The “performance grid” for the ARK funds shows high correlations and a synchronized bursting of the bubble in the underlying stocks of these funds. Only one fund still retains some gains from the pre-pandemic highs. The rest have completely reversed those gains and then some. The four worst performing funds are highly correlated, unsurprising given the common philosophy of speculating on companies chasing innovation. This strategy performed like a rocket ship when the Federal Reserve sponsored easy money, highly accommodative monetary policies. This strategy has so far completely backfired without that support. Now investors are more interested in pricing in risk than pricing in hopes and dreams.
This grid shows the performance over four important time periods in reverse chronological order: since last week’s bear market bottom, year-to-date, since the all-time high, since the pandemic low (March, 2020), since the pre-pandemic high (all based on closing prices). These numbers provide context for the potential upside as the funds struggle to regain their former momentum.
The ARK funds are not a place to go for diversification. Four of six of these funds each fell the same amount off all-time highs. They also enjoyed similar gains from the recent bear market bottom. Performance differentials show up with more time as in the comparisons to pandemic-related levels. The Autonomous Technology & Robotics ETF (ARKQ) avoided giving up all its pandemic-era gains with support from a heavy weighting in Tesla (TSLA) of 9.5%. Number two holding Trimble (TRMB) has also held up relatively well in the middle of this bear market.
Since bear market rallies tend to be sharp and swift, they often favor the most damaged goods in the market. Traders and speculators see these stocks as “cheap” and oversold. Moreover, shorts can (should!) move out of these names quickly in order lock in gains. Indeed, the most beaten-up ARK funds, based on YTD or the collapse from all-time highs, were the ones that bounced the most from the recent bottom. These price dynamics provide good targets for a range of strategies whether speculation, pairs trades, or shorting. This post of course is focused on bottoming levels.
The Levels
ARK Fintech Innovation ETF (ARKF)
ARKF is in a bullish position with the breakout above the former all-time low. ARKF is poised to rally at least back to its downtrending 20-day moving average (DMA) (the dotted line in the chart above). The former all-time low provides a natural stop-loss point. I would sell ARKF on a second close below this line under the assumption of higher risk of even lower prices. Note how a simple stop-loss rule would have saved a lot of money over the past several months.
Oversold trading conditions provide an important exception to this rule. Since markets form bottoms during oversold periods (like the current one), it is “too late” to sell during such periods – better to wait for the bounce from oversold levels.
ARK Genomic Revolution ETF (ARKG)
Two months ago, the ARK Genomic Revolution ETF (ARKG) bounced neatly away from its pre-pandemic high. Algorithms, whether human and/or robot, were clearly tuned to the full reversal of pandemic gains as a buying trigger. Such a trade worked briefly on ARKF after it approached its pre-pandemic high in January. What was support now becomes resistance as people who failed to bail at higher levels will see this level as a second chance to preserve capital. Such sellers showed up after May 4th when ARKF tested that line of resistance.
ARKG will first need to overcome resistance from the downtrending 20DMA. After that challenge, an even more important line of resistance comes from the 50DMA (the red line in the chart below). The downtrending 50DMA has guided ARKG downward for over a year. Traders faded brief breakouts. The recent widening gap between the 50DMA and 20DMA shows how selling recently accelerated.
I am not ready to trade a presumed bottom in ARKG without a test of the pandemic low. Instead, the attractive risk/reward levels will not come until ARKG breaks out above its pre-pandemic high.
The ARK Genomic Revolution ETF (ARKG) faces formidable overhead resistance levels from its pre-pandemic high and steeply downwardly sloping moving averages.
ARK Innovation ETF (ARKK)
ARKK is Cathie Wood’s flagship ARK ETF. ARKK hit $35.10 at its Thursday intraday low. The 41 cents distance from the pandemic low is “close enough” to a test. The 5.6% gain that day seemed to signal a successful test. Friday’s 11.8% gain confirmed the bottoming move. ARKK looks like a buy on the dips from here until/unless it closes below the pandemic low and triggers a potential stop loss.
Like ARKF and ARKG, the steep downtrend in the 20DMA offers a first point of overhead resistance and profit-taking/capital preservation. Over time, ARKK should be able to ride more positive sentiment to the downtrending 50DMA. A close above the pre-pandemic high should put the worst of the bear market and busted bubble in the rear view mirror for ARKK.
The ARK Innovation ETF (ARKK) bounced off its pandemic lows at its intraday low last week. ARKK will soon face a downtrending 20DMA which has held as resistance levels for most of the last 7 months.
ARK Autonomous Technology & Robotics ETF (ARKQ)
The ARK Autonomous Technology & Robotics ETF (ARKQ) last failed support when it sliced through the 2022 lows on May 5th. The selling occurred the day after ARKQ tested overhead resistance levels at the downtrending 20DMA. Like ARKG, I have little confidence that ARKQ carved out a battle-tested bottom. If a relief rally fails at the 20DMA, or even the 50DMA, I would expect an eventual test of the pre-pandemic high even though this scenario seems unlikely for now.
The ARK Autonomous Technology and Robotics ETF (ARKQ) is still holding on to some of its pandemic era gains. A further collapse to the pandemic lows seems unlikely for now.
ARK Next Generation Internet ETF (ARKW)
The ARK Next Generation Internet ETF (ARKW) came within a 5.1% loss of testing the pandemic low, not quite “close enough.” The selling going into that low was so steep, that I suspect ARKW will not make it to the downtrending 20DMA before selling off again. As a result, I have less confidence that ARKW has passed a test of bottoming levels.
The ARK Next Generation Internet ETF (ARKW) rebounded just before testing its pandemic low levels. The pre-pandemic high looms high above as a likely resistance level.
ARK Space Exploration & Innovation ETF (ARKX)
The ARK Space Exploration & Innovation ETF (ARKX) is essentially a no-touch for me. Sure it has the same price action at the recent lows as the other ARK funds, but there is insufficient price history to judge the sustainability of those lows. I would not even consider buying ARKX until it achieved a fresh 50DMA breakout…and stabilized from there.
The ARK Space Exploration & Innovation ETF (ARKX) is too new for pandemic-related comparisons. As a result, there are no clear levels of support to speculate about an end to these levels of all-time lows.
The Enablers
The bursting bubble for the ARK funds has provided Cathie Wood and her team a lot of opportunities to buy at lower and lower prices. Most mere mortals would quickly run out of money chasing price downward with this kind of Martingale strategy. A Martingale strategy features constant doubling down on bets. In the world of stocks, Martingale lowers the cost basis and shortens the time horizon to a positive return, assuming prices eventually recover. A healthy amount of support from cash inflows enables this strategy. The replacement of sellers with ARK buyers could, over time at least, provide stabilization for the underlying stocks. However, last week’s surge in fund inflows counters the theory that major bottoms happen after a major flush of sellers. The major drawdown in March provided only a temporary bottom.
$ARKK just posted its biggest week of inflows in over a year with $534m (Top 1% among ETFs). Now on 5th straight week of inflows, crazier tho its taken in nearly $2b since Feb 11th, during which its lost 39%. I've obv been vocal re ARK's staying power but even I'm surprised. pic.twitter.com/qRpSAiIjum
The above technical review went through the important levels to consider for evaluating bottoms in the ARK Funds. For some, these technicals could read and look like incantations to the trading Gods. I submit this assessment is no more mystical than the valuation arguments and rolling 5-year investment windows that supported the ARK bull case with little deference to mania-like market conditions. Innovation solves problems, but innovation has yet to nullify market cycles and the gravity of risk attitudes.
Given the high correlation in performance across the funds, the technicals could be most informative looking at all funds together. So, for example, ARKF delivered the most positive sign of a bottom with its ability to recover above the pandemic low. That milestone could create a positive cascade throughout these speculative ETFs. Similarly, a fresh breakdown in ARKF could very well signal an imminently renewed collapse in the rest of the group.
These unified price dynamics provide options for hedged strategies. The most promising should be pairs trades that feature going short one fund and long another (preferably with options on one side of the trade). I started such a hedged strategy by first opening short sides: short ARKQ shares and a calendar put spread on ARKK. I am looking to get long at least ARKF (call options) in the coming week. I will prefer to be net long the ARK funds as long as trading conditions are oversold. Positioning after the end of oversold trading will depend more on the levels I reviewed above.
Be careful out there!
Full disclosure: short ARKQ, long ARKK calendar put spread
Some stocks benefit greatly from an oversold bounce. Some stocks continue to dampen the mood. Today, retailers bruised an otherwise impressive continuation of the oversold bounce in the stock market. With retailers weighing down the market with poor implications for the macro environment, caution remains warranted. Still, the rebounds in the most beaten up parts of the market offer some attractive trading and investing opportunities. For example, over the weekend I reviewed the bottoming prospects for the thrashed group of ARK Fund ETFs.
Stock Chart Reviews – Below the 50-day moving average (DMA)
Upstart Holdings, Inc. (UPST)
Cloud-based artificial intelligence lending platform Upstart Holdings, Inc (UPST) has a classic signature of a stock rising from the ashes amid an oversold bounce. UPST collapsed a startling 56.4% post-earnings. The post-earnings closing low and the all-time low was the next day. This low coincided with the exact closing low of my favorite technical indicator, AT50 (T2108), the percentage of stocks trading above their respective 50-day moving averages (DMAs). Including today’s 23.5% surge, UPST is up 66.6% from the post-earnings closing low. With a close at a post-earnings high, UPST becomes a buy on the dips until/unless the all-time low breaks as support. The upside target for UPST is the former 2022 low from April.
Upstart Holdings, Inc. (UPST) closed at a post-earnings high and pushed itself into a bullish, oversold bounce positioning.
Wayfair Inc. (W)
Online furniture retailer Wayfair Inc (W) has yet to recover from its May 5th 25.7% post-earnings loss. The accelerated post-earnings downtrend remains in place despite today’s 8.6% jump. Until W manages to close above last week’s intraday high, the stock is one of many retailers weighing down the oversold bounce.
The Wayfair Inc. (W) gained 8.6% for the day but still failed to reverse the previous day’s loss. Post-earnings downward momentum persists.
Walmart Inc. (WMT)
There goes the “safety” trade. Walmart (WMT) is supposed to be a “safe” stock in recessionary and inflationary times. Instead, Walmart’s earnings revealed woes with inventory and labor force management and weighed down other large retailers. The entire retailing sector is now on the hotseat. WMT lost a startling 11.3% post-earnings and closed at a 15-month low. Suddenly, last month’s breakout to an all-time high looks like a big fakeout. With WMT trading well below its lower Bollinger Band (BB), the stock is a tempting buy. However, Karen Finerman’s bearishness on CNBC’s Fast Money regarding the WMT earnings news froze me in my tracks.
It was a washout for $WMT today, but @GuyAdami and @GrassoSteve agree: you can take a stab at the stock at these levels.
But if you don't want to, Grasso has you covered with some alternative picks. pic.twitter.com/arYrmDSvbT
The Walmart Inc. (WMT) crashed 11.3% and closed at a 15-month low.
TJX Companies, Inc. (TJX)
Discount retailer The TJX Companies, Inc (TJX) somehow survived an initial plunge in sympathy with WMT. TJX recovered from an 18-month low to close flat on the day. This move looks like a washout of sellers especially given the initial multi-month low. I want to buy TJX here with a stop loss below the intraday low. Note that earnings are coming Wednesday morning.
The TJX Companies, Inc. (TJX) rebounded from a pre-earnings washout to an 18-month low.
Roblox Corporation (RBLX)
Online video game platform Roblox Corporation (RBLX) pulled off a bullish rebound from an initial post-earnings calamity. RBLX sold off 4 straight days going into earnings. The next day the oversold period hit its low and RBLX gapped down 5.4%. However, RBLX closed the day UP 3.4%. That bullish reversal set up the next day’s 19.2% surge. I rushed to buy a ratio calendar call spread thinking RBLX would churn a bit. Instead, the rally kept apace, and my position hit its initial profit target. I moved into the pullback with shares. RBLX trades at “only” 7x sales and actually earns profits. As a result, I like accumulating a position from here. I think RBLX is a future acquisition target given its popularity and potential to play a role in the metaverse.
Roblox Corporation (RBLX) printed a bullish reversal from a post-earnings all-time low The rally now rests on 20DMA resistance.
Lucid Group, Inc. (LCID)
Back in the good ol’ days of speculative growth stocks, I bought the September collapse in luxury EV maker Lucid Group, Inc (LCID) in full confidence. The profits I took from the subsequent rally paid for my core position (what is called riding the house’s money). Now LCID is right back to those levels, and I am hesitating to try the same trade again. LCID is still sitting on losses from its May 5th earnings report.
The oversold bounce has not yet broken through 20DMA resistance. In fact, LCID needs to conquer the last peak just to generate enough momentum to challenge overhead resistance from the declining 50DMA. This stock market is simply not the place to take a swing on a profitless company valued at 355x sales. I will just remain patient (for who knows how long). Of course I still LOVE the company and the car.
Lucid Group, Inc. (LCID) stalled at its 20DMA line of resistance after a bullish reversal to start the oversold bounce.
FIGS, Inc. (FIGS)
I knew FIGS, Inc (FIGS) was on the expensive side. Still, last week’s post-earnings collapse surprised and disappointed me. I guess there are not enough people buying into my idea to wear medical scrubs as comfort wear. FIGS crashed 25.0% post-earnings and has only rebounded meekly with the oversold bounce. The company lowered guidance “citing macro factors and supply chain challenges.”
FIGS, Inc. (FIGS) crashed 25.0% post-earnings and still trades within the shadow of its all-time low. FIGS IPO’s 11 months ago at $22.00 and opened at $28.30.
Teladoc Health, Inc. (TDOC)
Teledoc Health, Inc (TDOC) is still convalescing after a 40.2% post-earnings thrashing. TDOC was last at these prices in early 2018. Undeterred, Cathie Wood and team loaded up on yet more shares of TDOC. Here is what the team had to say about the disaster in its weekly email covering the portfolio’s big movers:
“Our five-year thesis for Teladoc is built around the company’s transition from a general telehealth provider to a B2B enterprise solution for whole-person healthcare. To measure the company’s progress, we track utilization––which has increased 160% since 2019––multi-service adoption––which has increased from 67% to 78% over the past year––and competitive wins. One recent example is its new contract with Northwell, New York’s largest health system, which Teladoc won from a competitor based on its multi-faceted platform.
That said, given the tumultuous market dynamics in digital care, management would have served shareholders and other stakeholders better with a strategy of under-promising and over-delivering. Nonetheless, we do believe that Teladoc’s long-term competitive position and product differentiation are unmatched, gearing it for superior growth over the long term.”
This commentary was the FIRST time I have seen the ARK folks say anything close to negative about a portfolio company.
If TDOC is doing anything right, the stock chart has obscured the promise since the all-time high in February, 2021. TDOC is down 89% from those lofty times. Trading at 4+ year lows indicates the pandemic meant nothing during a the best of times for telemedicine. Now priced at 2x sales and 0.5x book, TDOC truly looks under-valued. At its peak valuation, TDOC traded close to 25x sales. I imagine the company could truly be a steal of a deal when it finally starts earning profits.
Teladoc Health, Inc. (TDOC) woes continued with a 40.2% post-earnings collapse. The stock now struggles to hold price levels last seen over 4 years ago.
NVIDIA Corporation (NVDA)
Even mighty semiconductor chipmaker NVIDIA Corporation (NVDA) has suffered in the April to May sell-off. March’s bullish 50DMA and 200DMA breakouts are a distant memory. Now NVDA trades under its downtrending 20DMA and just rebounded from an 11-month low. NVDA trades at a 45.6% discount to its all-time high. With a still extremely rich valuation of 17x sales and 17x book, I am not putting NVDA on the shopping list. There are other semiconductor companies of interest…
NVIDIA Corporation (NVDA) gained 5.3% but stopped short of downtrending 20DMA resistance.
Stock Chart Reviews – Above the 50DMA
Advanced Micro Devices Inc (AMD)
The oversold bounce has helped push semiconductor chipmaker Advanced Micro Devices Inc (AMD) over its 50DMA. An upgrade helped provide the fuel. AMD will be in a bullish position if buyers follow through from here. Still, overhead resistance at the 200DMA looks likely. AMD has a relatively attractive valuation of 5.9x sales and 2.6x book. If I did not already own shares, I would start accumulating here. I am definitely moving to add shares if AMD returns to or through its last lows.
*Charting notes: Stock prices are not adjusted for dividends. Candlestick charts use hollow bodies: open candles indicate a close higher than the open, filled candles indicate an open higher than the close.
With the prospects of a bottom for this bear market, I am getting a little more interested in individual stock narratives. The bear market rubble is extensive. The gems are dispersed across a wide area. These stock charts provide one framework for sifting through the trash and the opportunity.
{note: in this edition, the stock charts have a linear scale. Charts will go back to log scale going forward}
Stock Chart Reviews – Below the 50-day moving average (DMA)
Spotify Technology (SPOT)
Since suffering a 12.4% post-earnings loss, Spotify Technology (SPOT) has been making a quiet comeback. SPOT has reversed those losses and now floats above its 20-day moving average (DMA) (the dotted line below). Overhead resistance at the 50DMA (the red line below) presents a major test. Since the November 50DMA breakdown, SPOT has only managed to close above this line of resistance ONCE. Thus, I will treat a confirmed 50DMA breakout as being very bullish for SPOT.
Spotify Technology (SPOT) successfully reversed all its post-earnings loss.
Nucor Corp. (NUE)
Steelmaker Nucor Corp (NUE) suffered a blow-off top along with April earnings. The stock finished with a 3.8% gain but had a 12.0% gain before sellers took control. Sellers continued the pressure with an 8.3% pullback that confirmed the blow-off top. NUE has not been the same ever since. May’s defense of 200DMA support (the blue line below) gives some hope of stabilization.
The blow-off top particularly sticks out because Nucor’s guidance could not get more bullish: “We expect that the second quarter of 2022 will be the most profitable quarter in Nucor’s history, surpassing the previous record set in the fourth quarter of 2021.” Is this as good as it gets?
Nucor Corp. (NUE) is trying to hang on to 200DMA support.
Lyft, Inc (LYFT)
Lyft, Inc (LYFT) has essentially been lifeless since its 29.9% post-earnings collapse. A Bollinger Band squeeze is converging on the meandering price action. The resolution of the squeeze could catalyze the next big move. I want to trade in the direction of the break. Note that LYFT hit an all-time low of $16.05 at the pandemic lows in March, 2020. Thus, the coming squeeze is also a critical test of LYFT’s remaining resilience. LYFT IPO’d at $72 in April, 2019 and never closed higher.
How long can Lyft, Inc. (LYFT) continue to avoid piercing its way to all-time lows?
Carvana Co. (CVNA)
Online used car company Carvana Co. (CVNA) was a pandemic darling. CVNA already had a churning uptrend in place when the pandemic hit. The largesses of stimulus turbocharged CVNA as the stock accelerated from a low of $29.91 to $370.10 in 16 months. With the stock now back to those pandemic lows, it is hard to even imagine what the excitement was all about…. even with the historic run-up in the price of used cars.
With the stock now trading at a mere 0.2 times sales, CVNA should look like a bargain. Unfortunately, Carvana continues to record negative operating income. If CVNA could not profit during the most favorable environment for used cars in decades, how will it earn positive operating income in a slow-growth or recessionary environment? With a ballooning debt load, CVNA will need to dilute shareholders with stock offerings and/or do some fancy refinancing to heal its financials.
Insider buying adds to the intrigue on CVNA. It is perhaps telling that, so far, the stock has not received a boost of encouragement from the purchases.
Carvana Co. (CVNA) lost 13.0% in what continues to be a volatility churn to lower and lower prices.
BHP GROUP LIMITED (BHP)
The 200DMA continues to provide approximate support for diversified commodities producer BHP Group Limited (BHP) for most of this year. I decided to stay out of the stock until it can print a bullish breakout above its 50DMA.
BHP GROUP LIMITED (BHP) looks trapped for now between its 50DMA resistance and 200DMA support.
Walmart Inc. (WMT)
My post-earnings trades in Walmart Inc (WMT) proved timely. I took profits on the call option and then the call spread across Friday and today. I am holding my shares for the long-term recovery.
Walmart Inc. (WMT) is attempting a V-recovery from its post-earnings collapse.
Nutanix, Inc. (NTNX)
I almost forgot about Nutanix, Inc (NTNX), and a 23.0% post-earnings collapse made me wish I had never remembered the stock. I made the bullish case on NTNX almost two years ago. From there, I successfully traded in and out of the stock. So in March when I saw NTNX traded back to those levels from two years ago, I jumped on the shares. Things looked pretty good until the new lows in May. I ignored that pre-earnings warning sign. NTNX traded as low as $13.51 but did not quite reach its pandemic lows.
I cannot help thinking NTNX is a steal here for the original bull case, but I will stay patient. There is no point in chasing the stock downward. I am fine to wait for a post-earnings closing high.
Nutanix, Inc. (NTNX) surged off its post-earnings intraday low but buyers have yet to reappear.
CME Group Inc. (CME)
I expected an exchange like the CME Group Inc (CME) to do well in the frenetic trading characterized by this bear market. Instead, CME broke down like so many others. CME found support at last September’s lows but could struggle to push through its downtrending 20DMA. A breakout above that resistance would quickly put a run to converged resistance at the 50 and 200DMAs into play.
CME Group Inc. (CME) found new life with the stock market’s bounce from oversold conditions. The updrift ended weeks of persistent selling.
ISHARES 20+ YEAR TREASURY BOND ETF (TLT)
In early April, I wrote about a put option trade in iShares 20+ Year Treasury Bond ETF (TLT) called “Trading Around Soaring Interest Rates.” Amazingly, the trade is working almost exactly as I would have hoped. Last week, I took profits on the short side of the trade. Today’s 2.1% drop in TLT took the long side to even. I held my ground on closing out the trade to see whether sellers have any follow-through this week. I am also holding weekly puts expiring on Friday.
Corning Inc (GLW) was looking pretty resilient with a bullish post-earnings breakout in January. The 2-week run was as high as GLW would get for the year to-date. GLW turned in a much more modest positive performance in April. Now GLW is struggling to hold a pivot around its 50DMA. I never got a position in GLW. I am now just waiting for the next 200DMA breakout.
Corning Inc. (GLW) has tried and failed to break free of 50DMA resistance for a month.
Dollar Tree, Inc. (DLTR)
Earnings for Dollar Tree (DLTR) helped bring the week of retail pain to an end…. and I breathed a sigh of relief. The wild gyrations in DLTR demonstrate just how little the market understands sometimes. DLTR cratered 14.4% in sympathy with Target (and Walmart) earnings. Technical traders sniffed out the opportunity by holding ground at 200DMA support. A 21.9% post-earning surge took DLTR right back where it started. The stock is now trying to hold 50DMA support…and I am trying to find reasons to keep holding the stock. I will have to preserve profits on a fresh post-earnings close.
Dollar Tree, Inc. (DLTR) found firm support at its 200DMA before a post-earnings surge returned the stock to its prior bullish position.
Ulta Beauty, Inc (ULTA)
Like Dollar Tree, Ulta Beauty, Inc (ULTA) fought back sympathy selling in retail with its own post-earnings surge. ULTA soared 12.5% and almost challenged its all-time high set just in April.
Ulta Beauty, Inc (ULTA) rebounded from a 10-month closing low in the lead-up to a bullish post-earnings breakout.
THE BEACHBODY COMPANY, Inc. (BODY)
I almost gave up on health and wellness platform The Beachbody Company (BODY). However, a series of timely purchases by CEO and Chair Daikeler Carl gave the stock a fresh burst of hope. Carl spent almost $1M accumulating stock. Now BODY has a confirmed 50DMA breakout. I like adding to my shares here. Negative operating income is one of the bigger risks for the company
THE BEACHBODY COMPANY, INC (BODY) rose from the dead of the $1.00 point and benefited from insider buying. The rising volumes highlight the bullish tint of the 50DMA breakout.
*Charting notes: Stock prices are not adjusted for dividends. Candlestick charts use hollow bodies: open candles indicate a close higher than the open, filled candles indicate an open higher than the close.
A month ago I laid out the case and conditions for bottoming across the collection of ARK funds. The key pivot rested with the ARK Fintech Innovation ETF (ARKF). It still is the first and only of the pre-pandemic ARK funds to break its pandemic era closing low. Over the past month, ARKF struggled mightily to break away from that all-time low. Unfortunately, a 6.0% loss on Friday took the steam out the fight and sent ARKF decisively lower. That breakdown represents a significant setback for the ARK Funds in the fight for bottoming levels.
The ARK funds soared on the easy money policies that bridged the economy over pandemic era lockdowns, and the funds are proving incapable of freeing themselves from the downward drag of monetary tightening. Accordingly, the main thing that can “save” these funds in the short-term is an upside surprise from the Federal Reserve. Yet, if the Fed indeed gives in to the stock market’s cries of pain by standing down from normalizing monetary policy, the subsequent boost will likely prove temporary. The economic realities of stagflation are growing by the day. From Cathie Wood’s June 3rd update titled Inventories & Deflation (34:00 mark):
“We do believe the Fed will get the message that it cannot increase interest rates much more than it already has…By July when companies are talking about earnings and talking about the future, we think the Fed will get the message. This will be very positive for the equity markets. And this is what we’re waiting for. As I always say, darkest before the dawn.”
As a reminder, the ARK funds are ETFs (exchange traded funds), but they are niche and concentrated because of their shared theme: “innovation solves problems.” They trade very closely to each other and provide little room for diversification. Targeting innovative companies, some of which are yet to establish sustained commercial success, creates a portfolio full of speculative companies with a high dependence on investor enthusiasm for risk-taking and a willingness to pay premium prices for turbo-charged growth. Unfortunately, economic and corporate growth is dissipating along with investor appetites. The resulting 1-2 punch has created quite the calamity in the ARK funds. They transitioned from a perfect combination of tailwinds in the pandemic to a twisted convergence of perfect storms.
This next phase of bear market action comes along with downgrades in the private sector known as “down rounds.” To-date, Cathie Wood has fallen back to the high-priced valuations in the private markets to prove the mispricing of her collection of innovative companies. That barometer of risk-taking is starting to sour. As a result, the escape hatch for justifying high valuations is closing. Tech Crunch provides one of many examples:
“Many companies are now facing a Hobson’s choice between trying to maintain the high-flying valuation they’ve established over the last year — no matter the contortions necessary to do it — or conducting a “down round,” a financing that results in a lower valuation. And industry experts suggest the latter often makes more sense…
Brad Feld, who has been a venture capitalist for more than 25 years…says his “strong belief” that “just doing a clean resetting — at whatever the valuation so that everybody is aligned and dealing with reality — is much, much better for a company…
Even while he remains optimistic about the overall state of venture funding, founders “have to make the assumption that things will get worse from here, and that it’s going to take you twice as long to raise half as much money as you’re looking for.””
The time has likely long past for Wood and her ARK Fund colleagues to reset and adjust to the new reality of lower ceilings on speculation.
The Levels
ARK Fintech Innovation ETF (ARKF)
ARKF was in a bullish position with last month’s breakout above the former all-time low. ARKF rallied back to its downtrending 20-day moving average (DMA) (the dotted line in the chart below) as I expected. Unfortunately, ARKF failed to make further progress from there. ARK has experienced only three lower closes than Friday’s breakdown below the former all-time low.
I did not profit from ARKF’s rebound despite two tranches of call options. I also finally dumped ARKF’s second largest holding, Coinbase (COIN). My concerns appear in “Coinbase Global, Inc: When A Disclosure is Not A Disclosure.” I see little point in jumping back into ARKF until it breaks out above last week’s congestion range…or plunges to an extreme during oversold trading conditions.
The ARK Fintech Innovation ETF (ARKF) broke down below its former all-time low and set up a freshly bearish position.
ARK Genomic Revolution ETF (ARKG)
In March, the ARK Genomic Revolution ETF (ARKG) bounced neatly off its pre-pandemic high. From there, ARKG has been unable to break away from the gravitational pull of its downtrending 20DMA and 50DMA (the red line below). Assuming ARKG will continue to follow trends lower, a test of the pandemic low is coming soon. Last month, ARKG stopped well short of that test.
I still the attractive risk/reward levels for ARKG comes from a breakout above its pre-pandemic high.
The ARK Genomic Revolution ETF (ARKG) trades midway between two important levels but looks set to test its pandemic low.
ARK Innovation ETF (ARKK)
ARKK is Cathie Wood’s flagship ARK ETF. The technicals on ARKK look almost identical to ARKG’s technicals. The proximity to the pandemic low provides the main differentiator. ARKK trades 15.3% away from its pandemic low and is 33.9% off its pre-pandemic high. Like ARKF, ARKK is also heavily dependent on Coinbase. COIN is ARKK’s 4th largest position. Tesla (TSLA) is keeping ARKK aloft with its 9.3% allocation of ARKK’s funds, the highest share in ARKK. TSLA trades an impressive 864% above its pandemic low.
The ARK Innovation ETF (ARKK) trades much closer to its pandemic low than its pre-pandemic high.
ARK Autonomous Technology & Robotics ETF (ARKQ)
The ARK Autonomous Technology & Robotics ETF (ARKQ) is the only pre-pandemic ARK fund still trading above its pre-pandemic high. There are several stocks helping TSLA to prop up ARKQ. For example, Trimble (TRMB) remains 193% above its pandemic low. TSLA and TRMB are the two top holdings in ARKQ.
The ARK Autonomous Technology and Robotics ETF (ARKQ) is still holding on to a portion of its pandemic era gains. A test of the pre-pandemic high now looks imminent.
ARK Next Generation Internet ETF (ARKW)
The ARK Next Generation Internet ETF (ARKW) looks quite similar to ARKK. Like ARKK, TSLA is the fund’s top holding with an 8.7% allocation. COIN is the fund’s number 2 holding. Needless to say, I think the breakdown in ARKF greased the path for ARKW to test its pandemic low in due time.
The ARK Next Generation Internet ETF (ARKW) fell from the midway point between the pre-pandemic high and the pandemic low. A close below the May 24th low will set up an eventual test of the pandemic low.
ARK Space Exploration & Innovation ETF (ARKX)
The ARK Space Exploration & Innovation ETF (ARKX) remains a no-touch for me. ARKX has insufficient price history to judge the sustainability of May’s all-time lows. ARKX failed to trigger a buy with a 50DMA breakout. Instead, the ETF now trades below its 20DMA again. Number one holding TRMB is helping to keep ARKX aloft.
The ARK Space Exploration & Innovation ETF (ARKX) launched to little fanfare. After going nowhere from most of 2021, ARKX has lost 24.5% year-to-date.
The Enablers
The bursting bubble for the ARK funds gave Cathie Wood and her team many opportunities to buy at lower and lower prices. Investors have blessed ARK with the funds to continue doubling down and more. Eric Blachunas, Senior ETF Analyst for Bloomberg, last provided flow data on May 24th. While ARKK finally got hit with a week of major outflows, the take for the year is still a whopping $1.6B. ARK is definitely a corner of the market that has yet to suffer from investor negativity and bearishness despite the contrary price action.
Sure.. $ARKK finally saw inflow streak snapped last week with about $220m in outflows. Inflow yest tho. All told YTD flows are +$1.6b, ranking it 61st overall (Top 2%). The ARK family tho is $364m on year (which prob ranks it near top of active fund complexes in rough year) https://t.co/hNN9v8aVWapic.twitter.com/OVOi8PpAPM
My trading strategy on the ARK funds revolved around ARKF maintaining a bullish and bottoming position. ARK dealt that strategy an important setback that pushed me into a net bearish position on ARK funds. While two consecutive tranches of ARKF call options failed, I am still holding on to the partial hedges of ARKK put options and ARKQ shares short. The ARKK put options are the long side left over from a calendar put spread. I see no reason to get bullish on ARK funds until ARKF repositions above its former all-time low…at a minimum.
Still, the ARK funds are great candidates for trades on a bounce from oversold trading conditions. I expect these speculative funds to enjoy relatively large oversold bounces. In the meantime, a sustained bottom looks likely to remain elusive for ARK for now.
The January, 2022 bottoming sure looks like the good ol’ days now!
")
![Source: Board of Governors of the Federal Reserve System (US), Market Yield on U.S. Treasury Securities at 20-Year Constant Maturity [DGS20], Market Yield on U.S. Treasury Securities at 10-Year Constant Maturity [DGS10, Market Yield on U.S. Treasury Securities at 2-Year Constant Maturity [DGS2 retrieved from FRED, Federal Reserve Bank of St. Louis; February 13, 2022.](http://fred.stlouisfed.org/graph/fredgraph.png?g=M4hv "Market Yield on U.S. Treasury Securities at 2, 10, and 20-Year Constant Maturity")

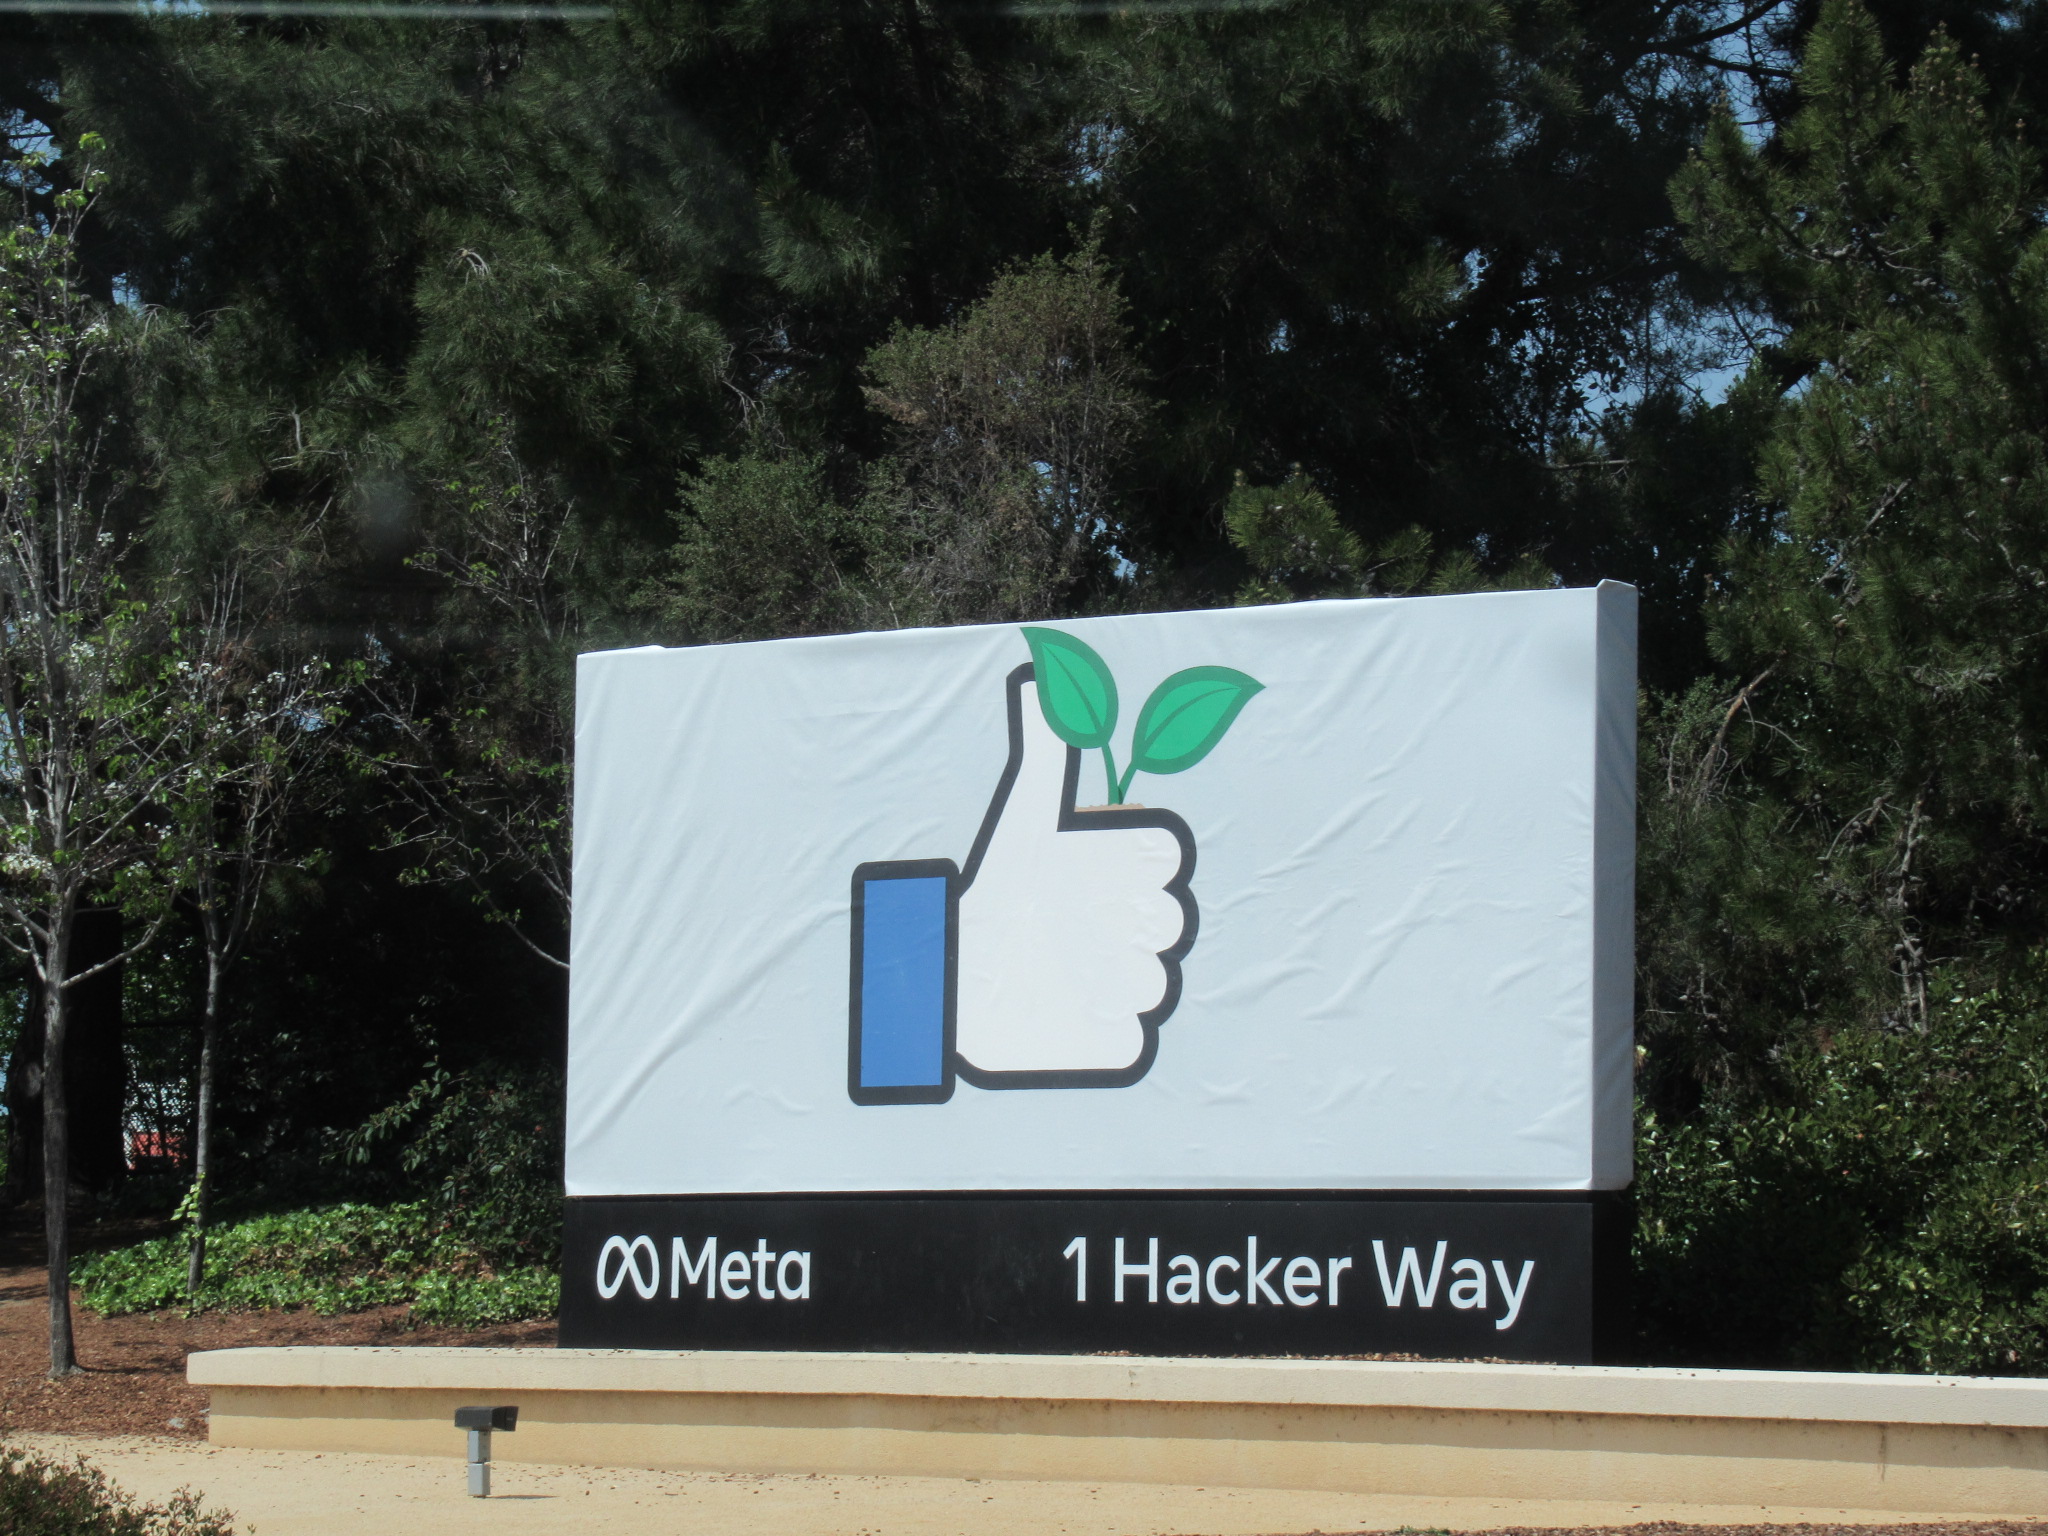
")
")
")
")
")
")
")
")
")
")
")
")


