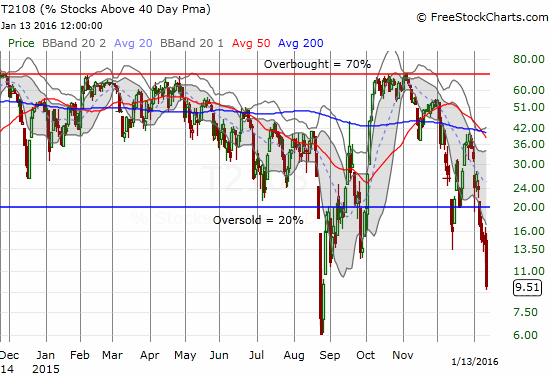
(T2108 measures the percentage of stocks trading above their respective 40-day moving averages [DMAs]. It helps to identify extremes in market sentiment that are likely to reverse. To learn more about it, see my T2108 Resource Page. You can follow real-time T2108 commentary on twitter using the #T2108 hashtag. T2108-related trades and other trades are occasionally posted on twitter using the #120trade hashtag. T2107 measures the percentage of stocks trading above their respective 200DMAs)
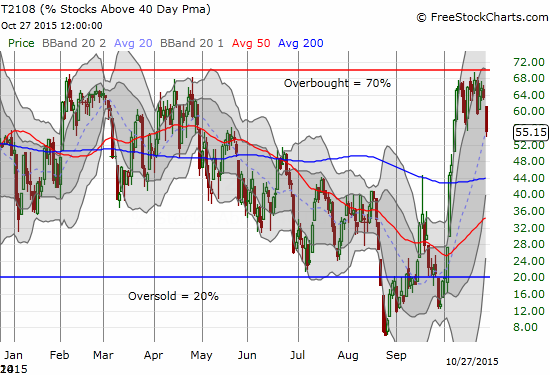
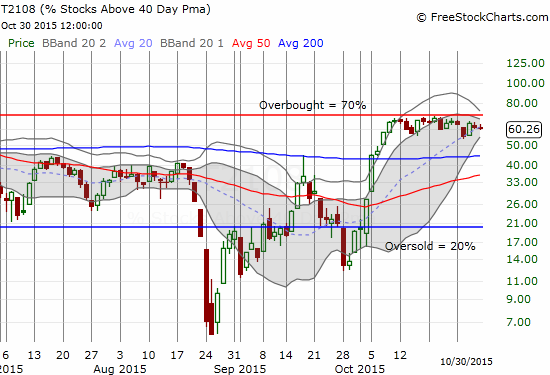
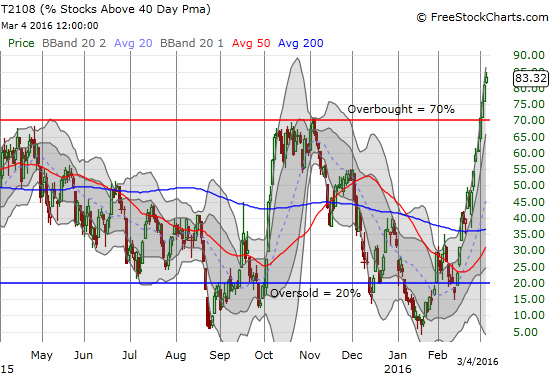
T2108 Status: 63.8%
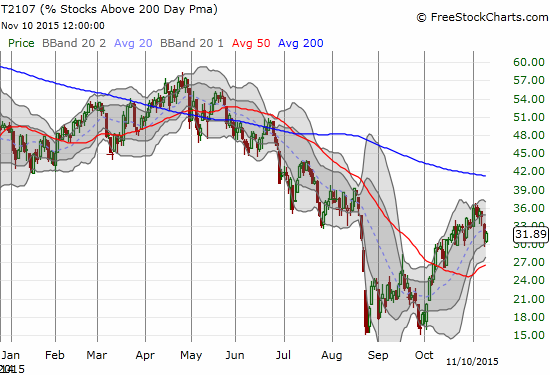
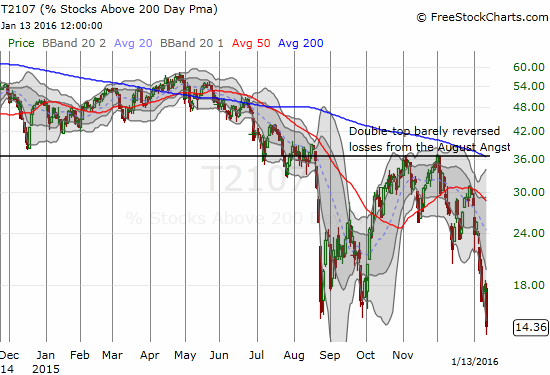
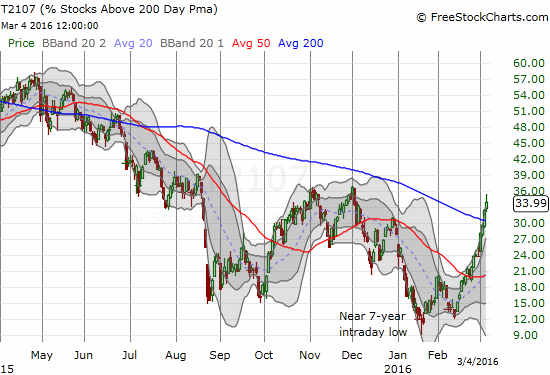
T2107 Status: 31.7%
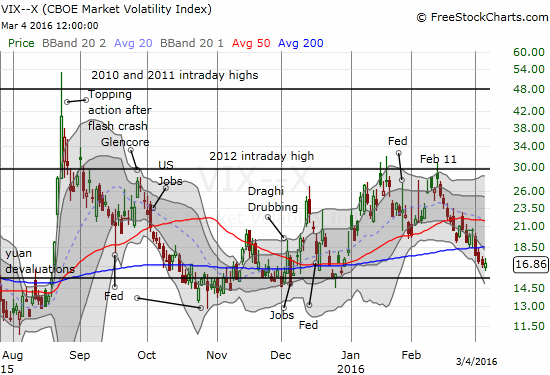
VIX Status: 14.5
General (Short-term) Trading Call: MILDLY bearish
Active T2108 periods: Day #15 over 20%, Day #14 over 30%, Day #14 over 40%, Day #12 over 50% (underperiod), Day #1 over 60% (ending 1 day under 60%) (overperiod), Day #329 under 70%
Reference Charts (click for view of last 6 months from Stockcharts.com):
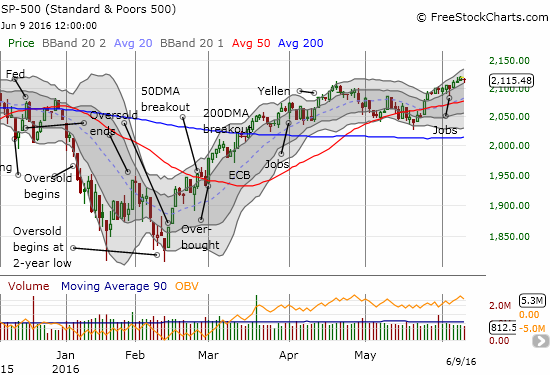
S&P 500 or SPY
SDS (ProShares UltraShort S&P500)
U.S. Dollar Index (volatility index)
EEM (iShares MSCI Emerging Markets)
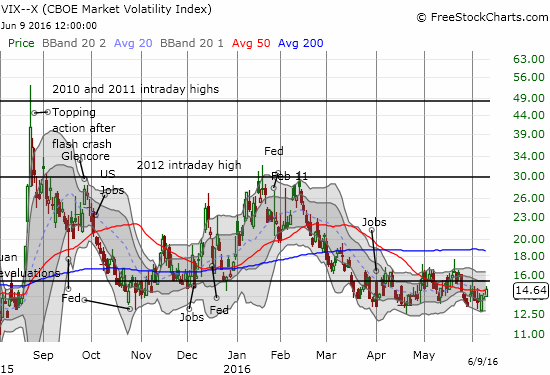
VIX (volatility index)
VXX (iPath S&P 500 VIX Short-Term Futures ETN)
EWG (iShares MSCI Germany Index Fund)
CAT (Caterpillar).
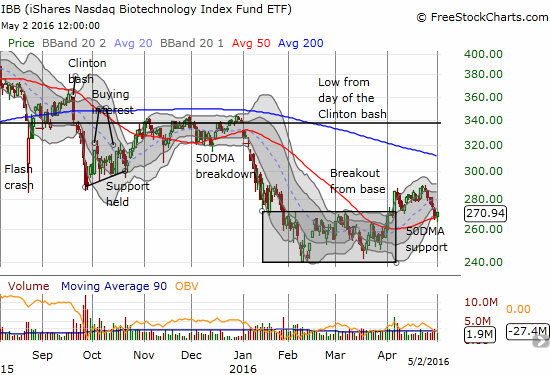
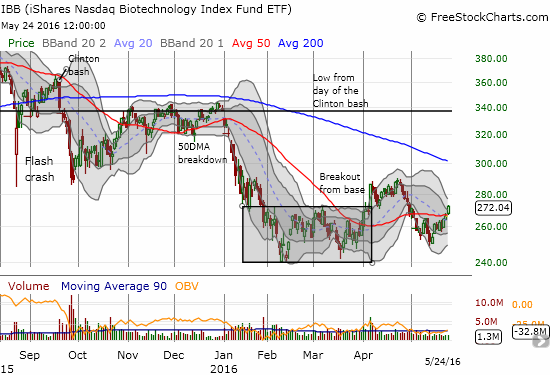
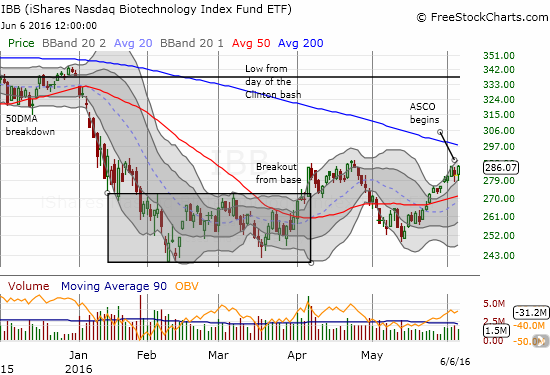
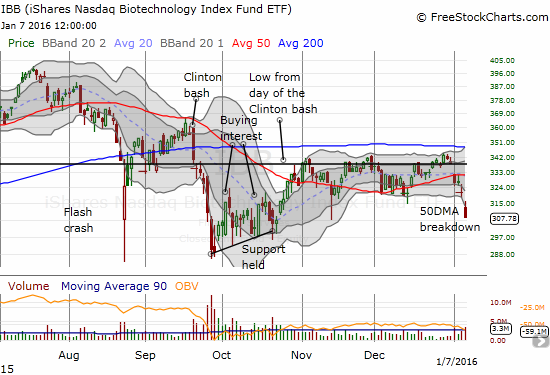
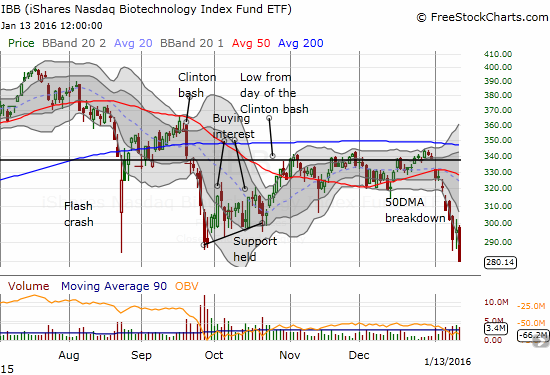
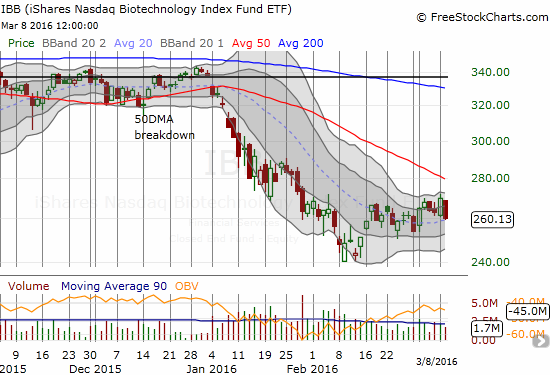
IBB (iShares Nasdaq Biotechnology).
Commentary
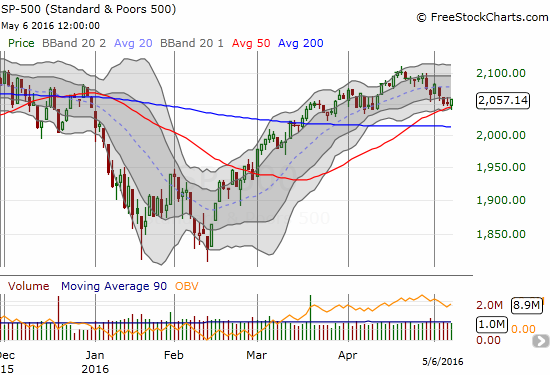
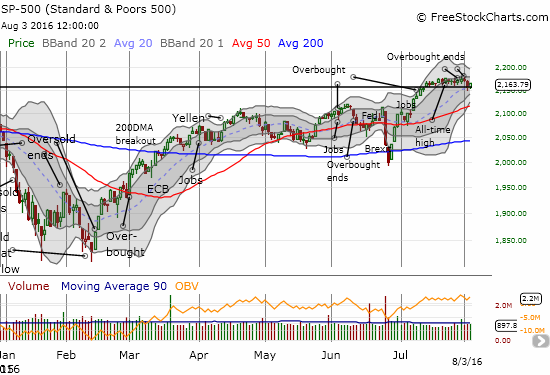
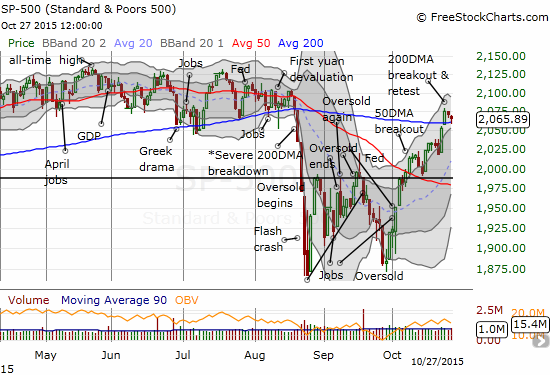
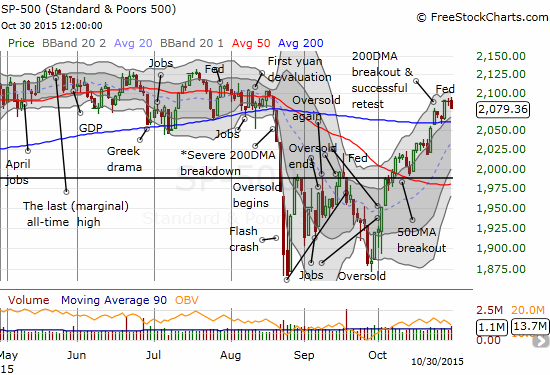
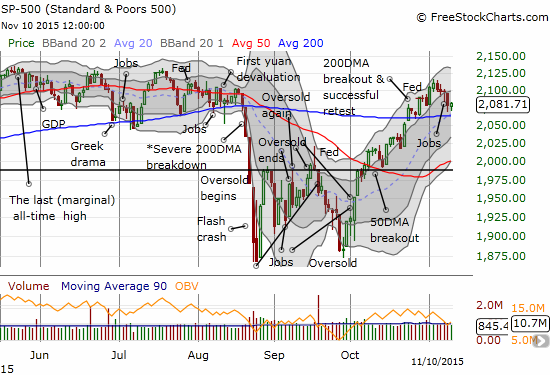
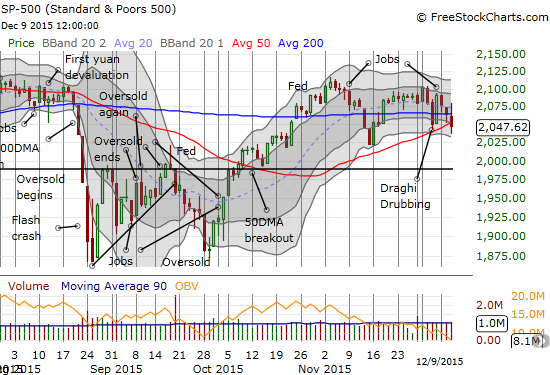
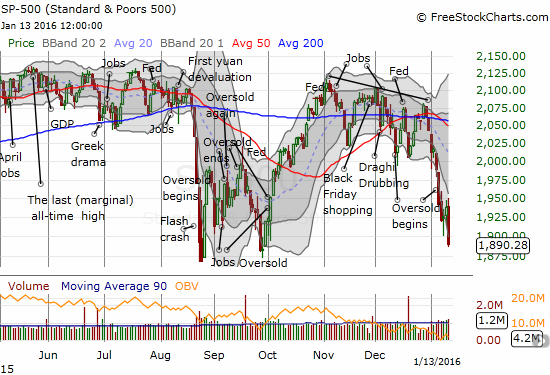
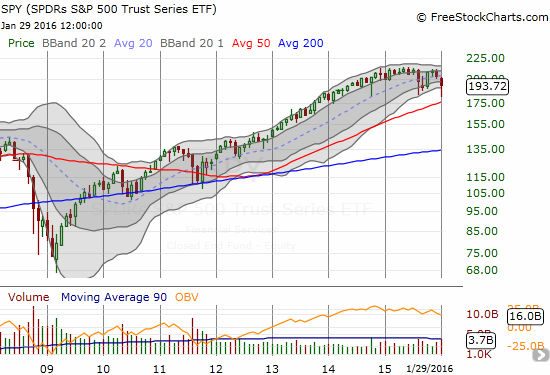
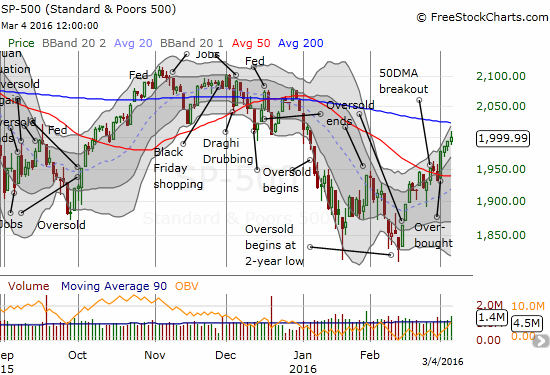
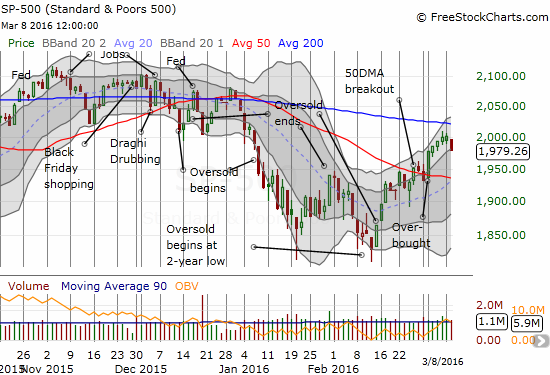
Just as I had given up the idea of a 200DMA test of resistance in favor of an earlier test of 50DMA support, the S&P 500 (SPY) staged a sharp reversal. Today’s strong 1.7% gain places the index just below a major test of strength and within a shout of completely reversing all of August’s sell-off.
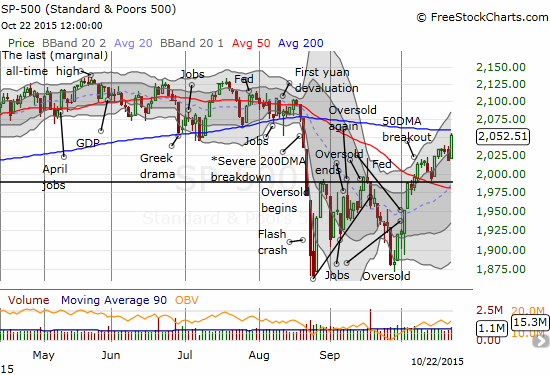
The S&P 500 leaves the prior day’s weakness in the dust. A major test of resistance now looms.
T2108 jumped as well but refused to break into overbought territory. My favorite technical indicator closed at 63.8% and even faded a bit off its highs. So the tease just below overbought conditions continues. In the last T2108 Update I declared T2108 had gotten close enough because, after all, T2108 has now gone 329 trading days without breaking through official overbought territory. With this context, “close enough” is sufficient.
More important is the meaning of overbought in this case. Until the S&P 500 breaks through 200DMA resistance AND follows through, my trading call will stay some shade of bearish (right now “mild”). If the index follows through on a breakout, I flip right back to bullish with the assumption that a major overbought rally is underway. Again, one step at a time.
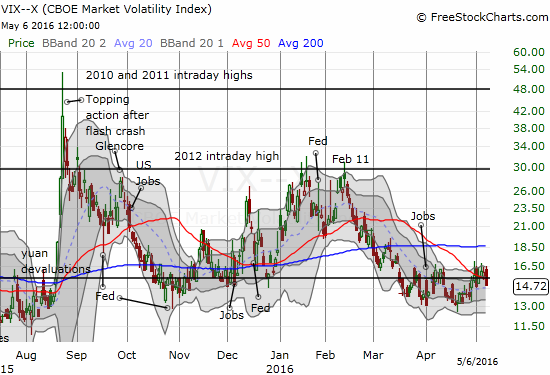
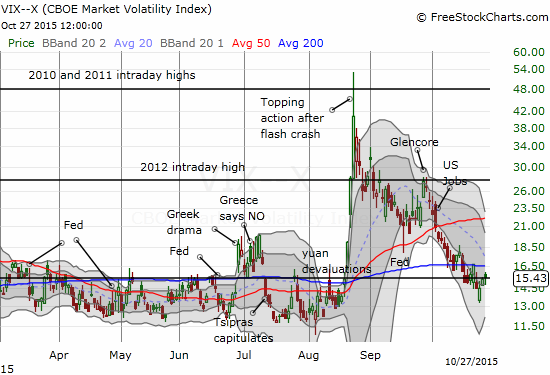
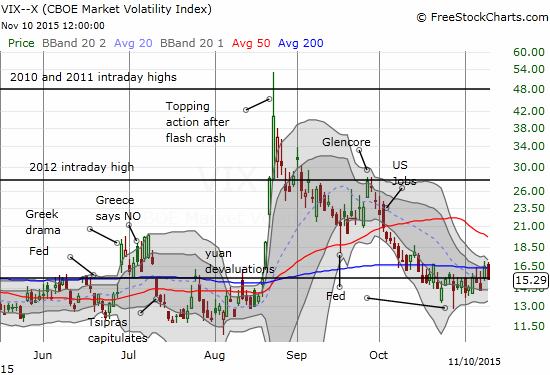
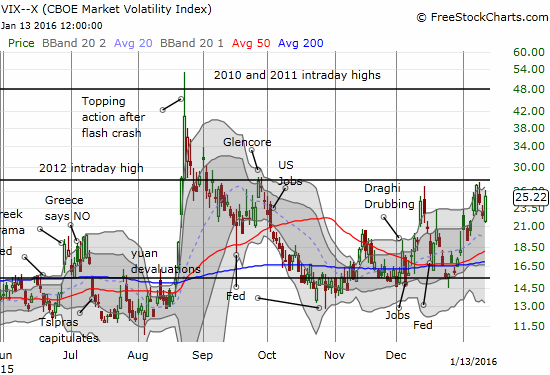
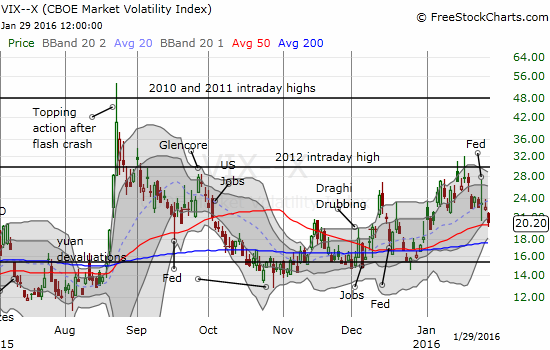
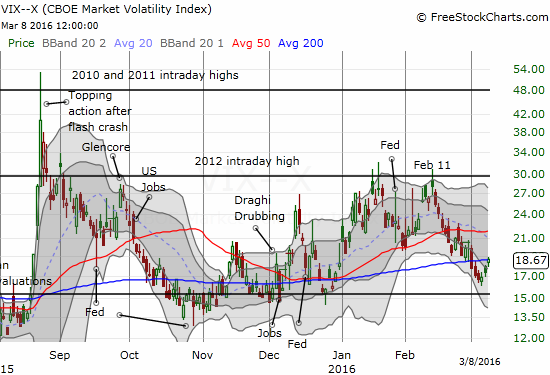
The volatility index was hit hard by the sudden return of excited buyers. The VIX hit a fresh 2-month low on a 13.5% decline and is once again below the 15.35 pivot – I call it a pivot for a good reason…
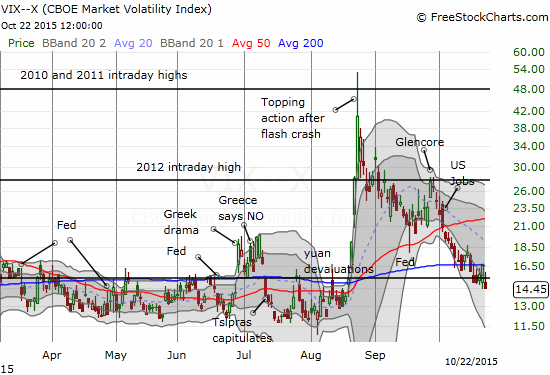
The volatility index quickly resumes its descent even as the 15.35 pivot serves as a magnet
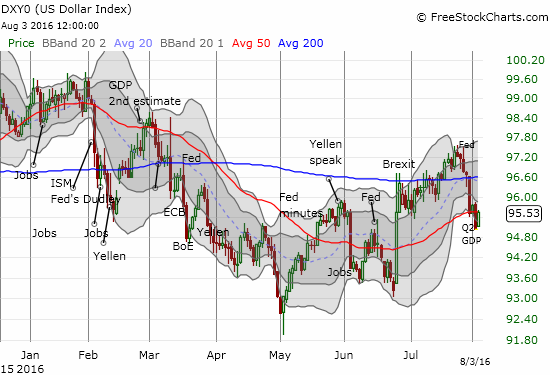
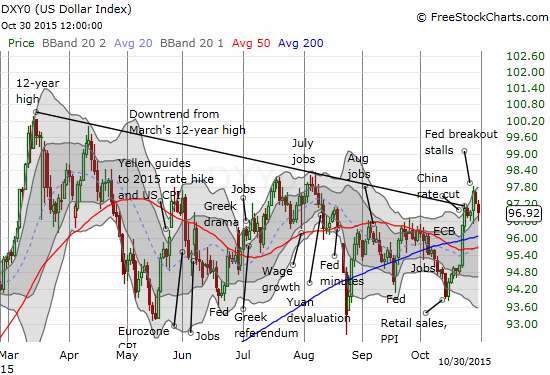
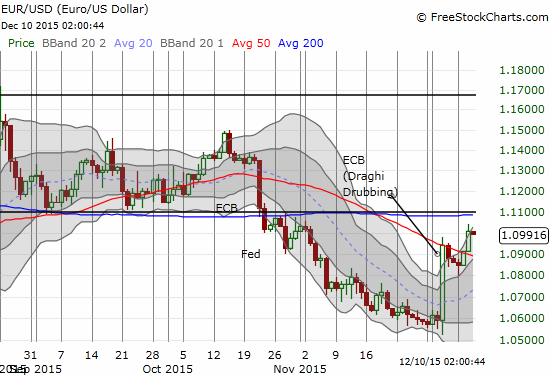
A major driver of the action was the European Central Bank (ECB). Whatever President Mario Draghi said (I hope to write a quick piece on it over the weekend), thumped the euro (FXE) and sent traders scrambling for “risk on” trades; I closed out my short on EUR/USD. The dollar index was a major beneficiary: “Super Mario” helped to save the dollar’s current trading range. The U.S. dollar even surged against the Japanese yen (FXY).
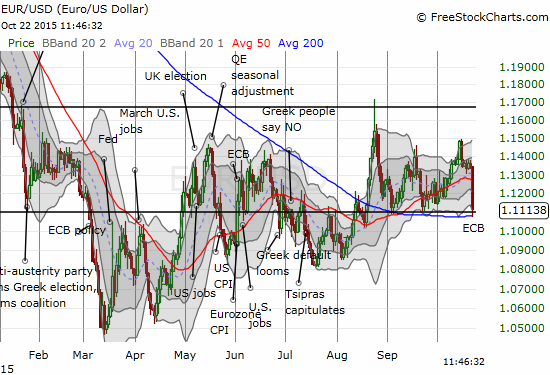
The euro plunges and faces its own critical 200DMA test against the U.S. dollar. A total breakdown looms.
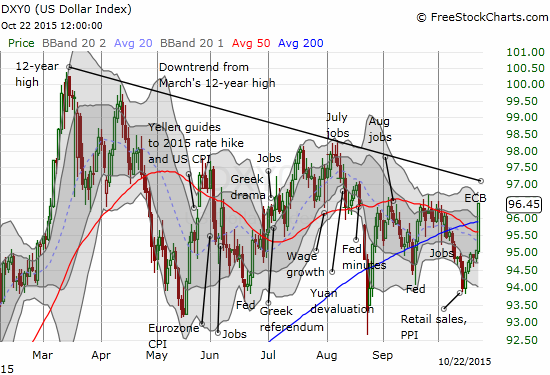
The dollar index confirms nice bounce from the lower depths of its on-going trading range. Can it finally break out from the short-term downtrend in place since March?
Once again, the currency markets are key to the stock market. This swift move is a game changer. If the euro proceeds to break down, the stock market could get a turbo boost. The next looming caveat would be yet another Fed meeting next week. The Fed may “decide” to counteract the U.S. dollar’s resurgent strength with an extra dose of deference to the uncertain economic conditions preventing it from starting its rate-tightening cycle. Paradoxically, the market could like that kind of talk as well!
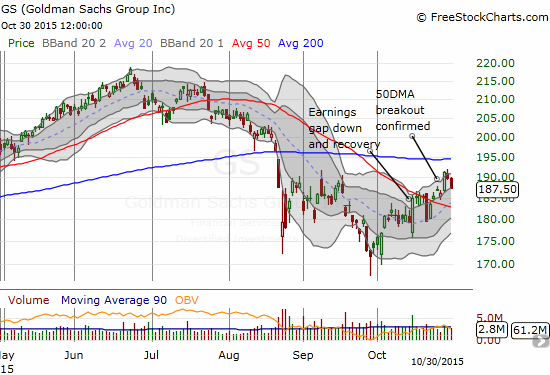
Although my trading bias is now set to mildly bearish, I found myself all day hunting down buying opportunities, especially in biotech. When I looked up and noticed my bullish posture, I hunted down Goldman Sachs and faded its bounce. I am looking for the 50DMA to hold as resistance.
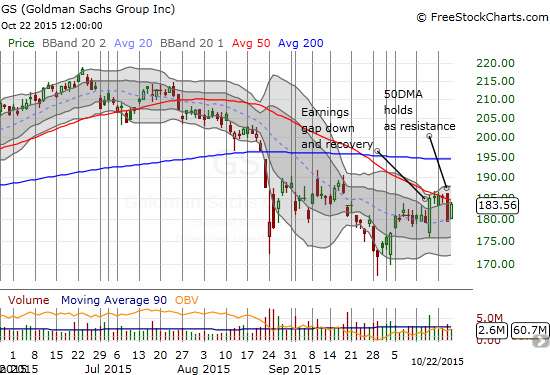
Goldman Sachs (GS) does not quite reverse the previous day’s sudden selling. For now, the declining 50DMA rules trading.
Even if GS eventually wiggles its way above its 50DMA I like it now as a hedge on bullishness. The stock overall looks very weak. If the next calamity for the market is a financial incident, GS could be right at the center.
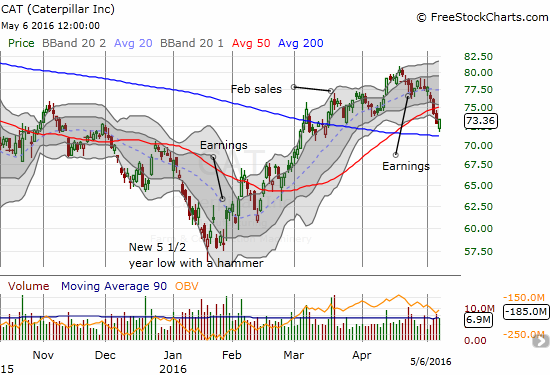
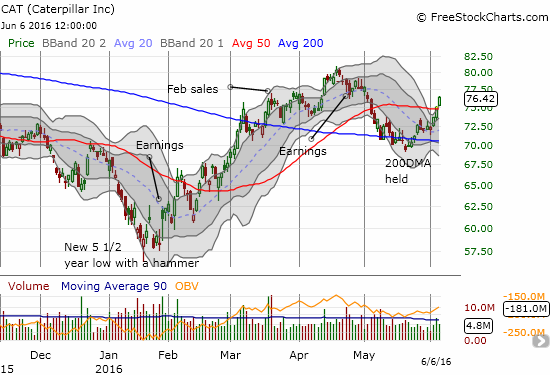
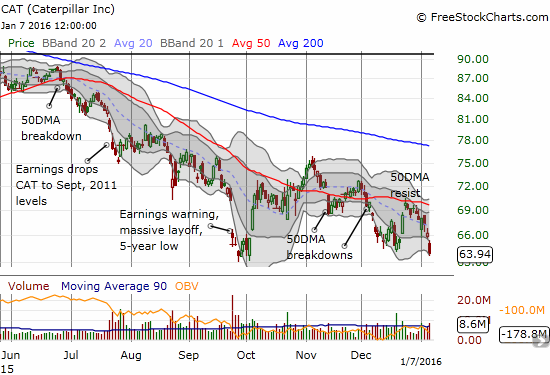
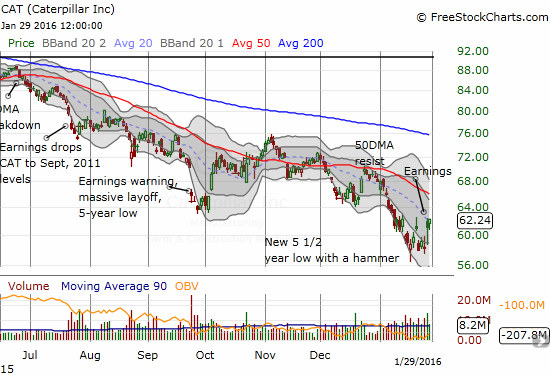
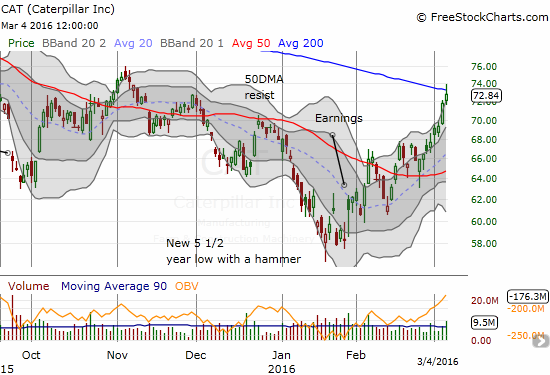
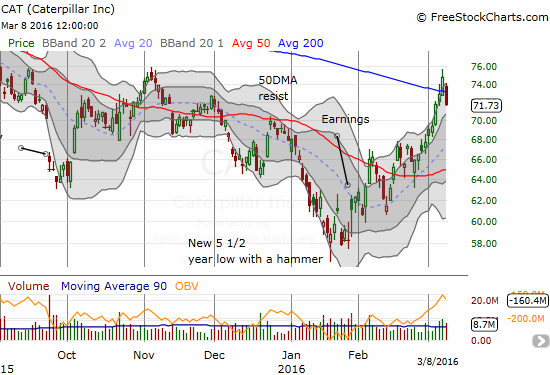
Speaking of hedges, Caterpillar (CAT) was the big post-earnings reversal of the day. It managed to stay green for the day even after its 50DMA resistance held strong. I was fortunate to rush in to call options near the open after I noticed buyers piling into the gap down. It turned into a quick double. I am still holding shares short.
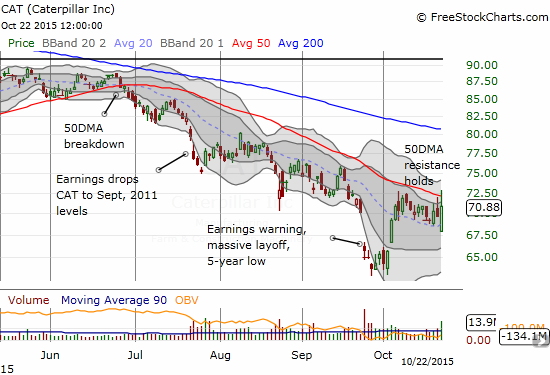
Caterpillar attempts a contrary move to breakout above its 50DMA resistance after first doing a post-earnings gap down.
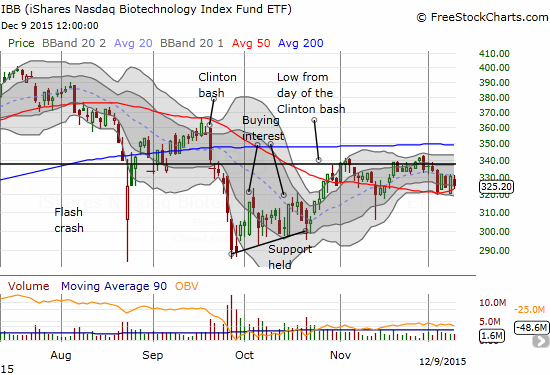
Back to biotech…
Earlier this month, I wrote about buying into Gilead Sciences (GILD) as a good bio-tech “catch-up” play. Since then, it has steadily, albeit in choppy fashion, marched higher even as the iShares Nasdaq Biotechnology ETF (IBB) has barely followed support off its lows. Today was a big day as GILD soared 5.8% for a double 50 and 200DMA breakout.
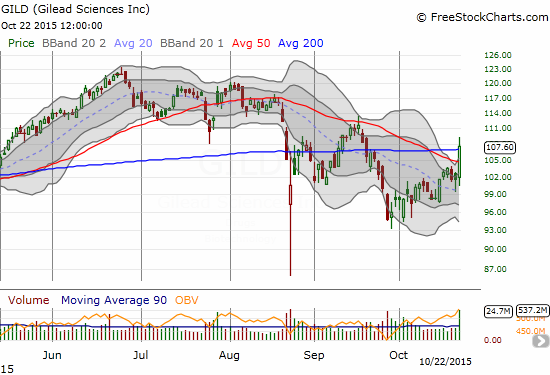
Gilead Sciences (GILD) rallies to the edge of a major breakout and end of its downtrend from recent highs
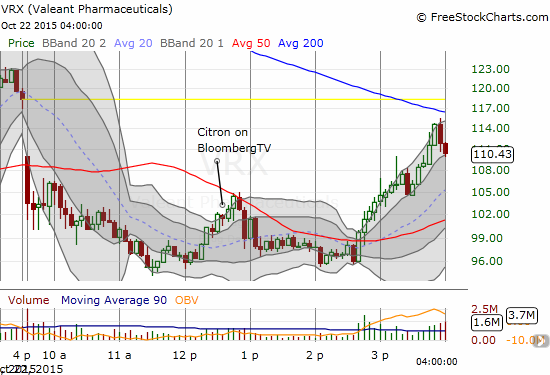
Given I had already made several successful trades on IBB and Valeant Pharmaceuticals (VRX), I was very content to sit on my GILD call options (they do not expire until next year). As I noted in the last T2108 Update, I was primed to lock in profits on my IBB call options. I also decided to lock in profits on my shares. That decision turned out well as it freed me to buy another intraday dip that I in turn flipped. VRX was in focus for me given its extreme sell-off the previous day. I bought a call option soon after the open given the stock gapped down an additional 7%. I was on the lookout for signs of strength; as soon as I noticed some, I added shares.
I later discovered that the short-selling firm Citron that took down VRX confirmed that Andrew Left would appear on BloombergTV at 12:30pm Eastern. I locked in profits on the shares ahead of that interview. Sure enough, the stock began to wane after 12:30pm. I set a limit order to double-down on my call option in case the selling got bad. I got filled in due time. I was not watching the interview, but I am guessing the strength returned after the interview ended. Going into the close, VRX was about 21% off its low of the day and I locked in substantial profits on my call options. VRX still ended the day down 7.4%, roughly flat with its open. This kind of wide-ranging volatility is a trader’s dream.
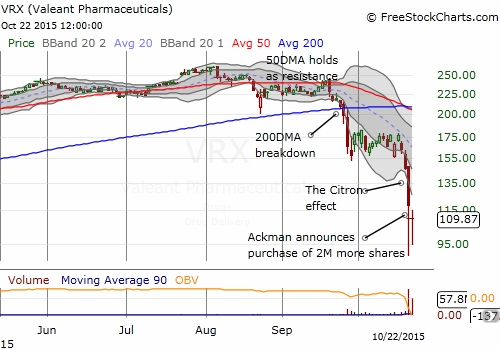
Valeant Pharmaceuticals (VRX) is struggling to get back on its feet after Citron’s squeeze
A roller coaster ride intraday equals a lot of trading opportunities.
One reversal I completely missed – by mere minutes – was in Build-a-bear Workshop (BBW). News of a significant recall of the company’s Starbrights Dragon sent investors selling in a panic. I hesitated just a few minutes and quicker, more calm traders and investors, stepped right in and relieved BBW of most its losses. Clearly, the market is jittery, but these jitters are often turning into major buying opportunities (even if short-term).
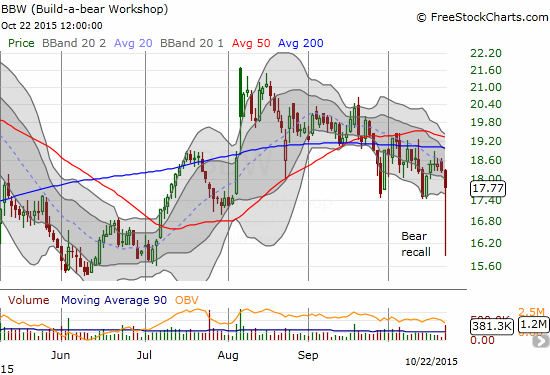
Build-a-bear Workshop craters momentarily as panic quicky gives way to cooler heads
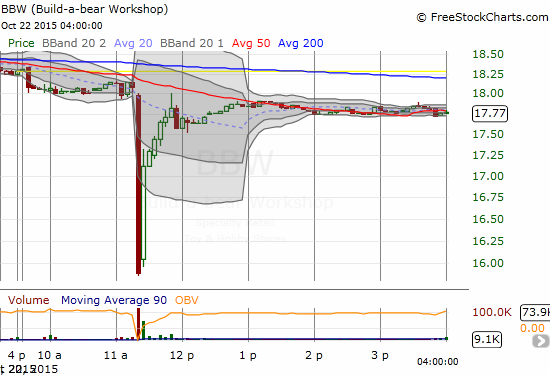
Build-a-bear Workshop’s buying opportunity lasted less than 10 minutes
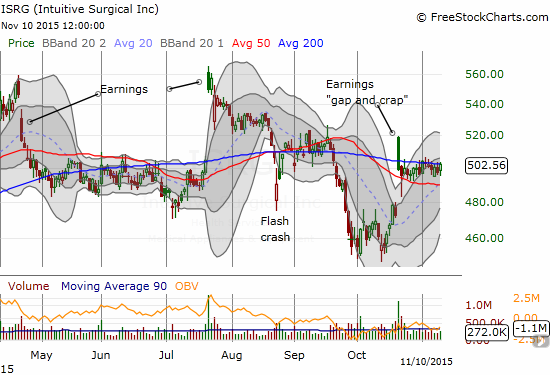
A reversal I inexcusably missed was Intuitive Surgical (ISRG). I was looking to follow-up the previous day’s success. I was watching the stock like a hawk…
$ISRG post-earnings fade continues. Now below the 50DMA. A gap-fill is now in play.
— Duru A (@DrDuru) Oct. 22 at 10:06 AM
…but after concluding that ISRG was on pace to completely fill its gap, I relaxed. Big mistake. ISRG eventually continued its sell-off, but when signs of life appeared it took off like a rocket into the close. The stock recovered from its 50DMA and even closed above the upper-Bollinger Band again.
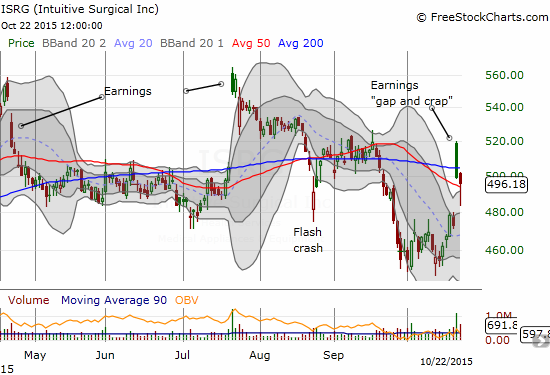
Intuitive Surgical (ISRG) comes back from a 50DMA breakdown and barely misses a complete fill of its post-earnings gap up.
Needless to say, after all this, I was not in a bearish mood. Now, Alphabet (GOOG) and Amazon.com (AMZN) got 10%+ after-hours gains after reporting earnings. It will be difficult to get in a bearish mood tomorrow (Friday, October 23rd). Stay tuned…
Daily T2108 vs the S&P 500
")
Black line: T2108 (measured on the right); Green line: S&P 500 (for comparative purposes)
Red line: T2108 Overbought (70%); Blue line: T2108 Oversold (20%)
Weekly T2108

*All charts created using freestockcharts.com unless otherwise stated
The charts above are the my LATEST updates independent of the date of this given T2108 post. For my latest T2108 post click here.
Related links:
The T2108 Resource Page
Expanded daily chart of T2108 versus the S&P 500
Expanded weekly chart of T2108
Be careful out there!
Full disclosure: long IBB call options, short CAT and GS, long GILD call options, net long the U.S. dollar


")